Recent decades have seen private wealth multiply around the Western world, making us richer than ever before. A hasty glance at the soaring number of billionaires – some doubling as international celebrities – prompts the question: are we also living in a time of unparalleled wealth inequality? Influential scholars have argued that indeed we are. Their narrative of a new gilded age paints wealth as an instrument of power and inequality. The 19th-century era with low taxes and minimal market regulation allowed for unchecked capital accumulation and then, in the 20th century, the two world wars and progressive taxation policies diminished the fortunes of the wealthy and reduced wealth gaps. Since 1980, the orthodoxy continues, a wave of market-friendly policies reversed this equalising historical trend, boosting capital values and sending wealth inequality back towards historic highs.
The trouble with the powerful new orthodoxy that tries to explain the history of wealth is that it doesn’t fully square with reality. New research studies, and more careful inspection of the previous historical data, paint a picture where the main catalysts for wealth equalisation are neither the devastations of war nor progressive tax regimes. War and progressive taxation have had influence, but they cannot count as the main forces that led to wealth inequality falling dramatically over the past century. The real influences are instead the expansion from below of asset ownership among everyday citizens, constituted by the rise of homeownership and pension savings. This popular ownership movement was made possible by institutional changes, most important democracy, and followed suit by educational reforms and labour laws, and the technological advancements lifting everyone’s income. As a result, workers became more productive and better paid, which allowed them to get mortgages to purchase their own homes; homeownership rates soared in the West from the middle of the century. As standards of living improved, life spans increased so that people started saving for retirement, accumulating another important popular asset.
Today, the populations of Europe and the United States are substantially richer in terms of real purchasing-power wealth than ever before. We define wealth as the value of all assets, such as homes, bank deposits, stocks and pension funds, less all debts, mainly mortgages. When counting wealth among all adults, data show that its value has increased more than threefold since 1980, and nearly 10 times over the past century. Since much of this wealth growth has occurred in the types of assets that ordinary people hold – homes and pension savings – wealth has also become more equally distributed over time. Wealth inequality has decreased dramatically over the past century and, despite the recent years’ emergence of super-rich entrepreneurs, wealth concentration has remained at its historically low levels in Europe and has increased mainly in the US.
Among scholars in economics and economic history, a new narrative is just beginning to emerge, one that accentuates this massive rise of middle-class ownership and its implications for society’s total capital stock and its distribution. Capitalism, it seems, did not result in boundless inequality, even after the liberalisations of the 1980s and corporate growth in the globalised era. The key to progress, measured as a combination of wealth growth and falling or sustained inequality, has been political and institutional change that enabled citizens to become educated, better paid, and to amass wealth through housing and pension savings.
In his book Capital in the Twenty-First Century (2014), Thomas Piketty examined the long-run evolution of capital and wealth inequality since industrialisation in a few Western economies. The book quickly received wide acclaim among both academics and policymakers, and it even became a worldwide bestseller.
Piketty’s narrative outlined wealth accumulation and concentration as following a U-shaped pattern over the past century. At the time of the outbreak of the First World War, wealth levels and inequality peaked as a result of an unregulated capitalism, low taxation or democratic influence. During the 20th century, wartime capital destruction and postwar progressive taxes slashed wealth among the rich and equalised ownership. Since 1980, however, goes Piketty’s narrative, neoliberal policies have boosted capital values and wealth inequality towards historic levels.
Immediately after publication, Capital generated fierce debate among economists, focused primarily on the book’s theoretical underpinnings. For example, Piketty had sketched a couple of ‘fundamental laws’ of capitalism, defining the economic importance of aggregate wealth. The first law stated that the share of capital income in total income (the other share coming from labour) is a function of how much capital there is in the economy and its rate of return to capital owners. The second law stated that the amount of capital in the economy, measured as its share in total output, is determined by the balance between saving to accumulate capital and income growth. While these laws were actually fairly uncontroversial relationships, almost definitions, they laid out a mechanistic view of inequality trends that attracted considerable attention and scrutiny among Piketty’s fellow theoretical economists.
My work arrives at a striking new conclusion for the history of wealth and inequality in the West
However, what the academic debate cared less about was the empirical side of the analysis. Almost nothing was said about the historical data and the empirical conclusions underlying the claims about U-shaped patterns and main driving forces. The void in critical scrutiny exposed a widespread disinterest among mainstream economists in history and the fine-grained aspects of source materials, measurement and institutional contexts.
In recent years, a new strand of historical wealth inequality research has emerged from universities around the world. It offers a more nuanced empirical picture, including new data and revised evidence, pointing to different results and interpretations. In Piketty’s book, most of the analysis centred on the historical experiences of France, and then there was additional evidence presented for the United Kingdom and Germany (together making up Europe) and the US. Newer work reexamines and extends the historical wealth accumulation and inequality trends. Some of these contributions also revise the earlier data series, such as those analysing Germany and the UK. Other studies expand the empirical base by incorporating previously unexplored countries, such as Spain and Sweden. A number of ongoing research projects into the history of wealth distribution examine more new countries, including Switzerland, the Netherlands and Canada. Their findings will soon be added to this historical wealth database.
My work with new data, published in my book Richer and More Equal (2024), arrives at a new conclusion for the history of wealth and inequality in the West. The new results are striking. Data show that we are both richer and more equal today than we were in the past. An accumulation of housing wealth and pension savings among workers in the middle classes emerges as the main factor producing greater equality: today, three-fourths of all private assets are either homes or long-term pension and insurance savings.
Underlying the change in personal wealth formation over the 20th century are a number of political and economic developments. The democratisation of the Western world began with the extension of universal suffrage during the 1910s. This movement initiated a process of reforming the educational system, to extend basic schooling to the population and facilitating access to higher education. New labour laws improved working life by restricting the working hours per day, allowing unions to be active. Better training and nicer workplaces raised worker productivity and earnings, creating opportunity for working- and middle-class households to purchase their own homes. The improved living standards also led to longer lives. Between the 1940s and today, life expectancy at birth increased by almost 20 years in Western countries, most of which were spent in retirement. Pension systems started evolving during the postwar era, both as public-sector unfunded systems based on promises about a future income, and as private-sector funded systems where individual pension funds were accumulated as part of people’s long-term saving.
At the core of the new findings are three empirical observations.
The first is that the populations in Western countries are richer today than ever before in history. By rich, again, I mean having a high level of average wealth in the adult population. Why this measure of riches captures relevant aspects of welfare is because higher wealth permits a lot of good things in life. It allows for higher consumption, more savings and larger investment for future prosperity. It also promises better insurance against unforeseen events. Figure 1 below illustrates the growth in the average real per-capita wealth in a selection of Western countries over the past 130 years. It is dramatic. During the first half of the past century, the average wealth in the Western population hovered at a stable level. Since the end of the Second World War, asset values started to increase, doubling the level in only a couple of decades. From 1950 to 2020, average wealth in the West increased sevenfold.
Over the past 130 years, a monumental shift in wealth composition has taken place
A fact to notice specifically is how wealth has grown each single postwar decade up to the present day. For several reasons, this consistency of growth is a marvel. It affirms the robustness of the result: we are wealthier today than in history, and this fact does not depend on the choice of start or end date but holds regardless of the time period considered. The steady increase in wealth is not confined to investment-driven growth in Europe’s early postwar decades. Neither does it hinge on the market liberalisations of the 1980s and ’90s. However, it is notable how the lifting of regulations and the historically high taxes since the 1980s are indeed associated with the highest pace of value-creation that the Western world has ever experienced.
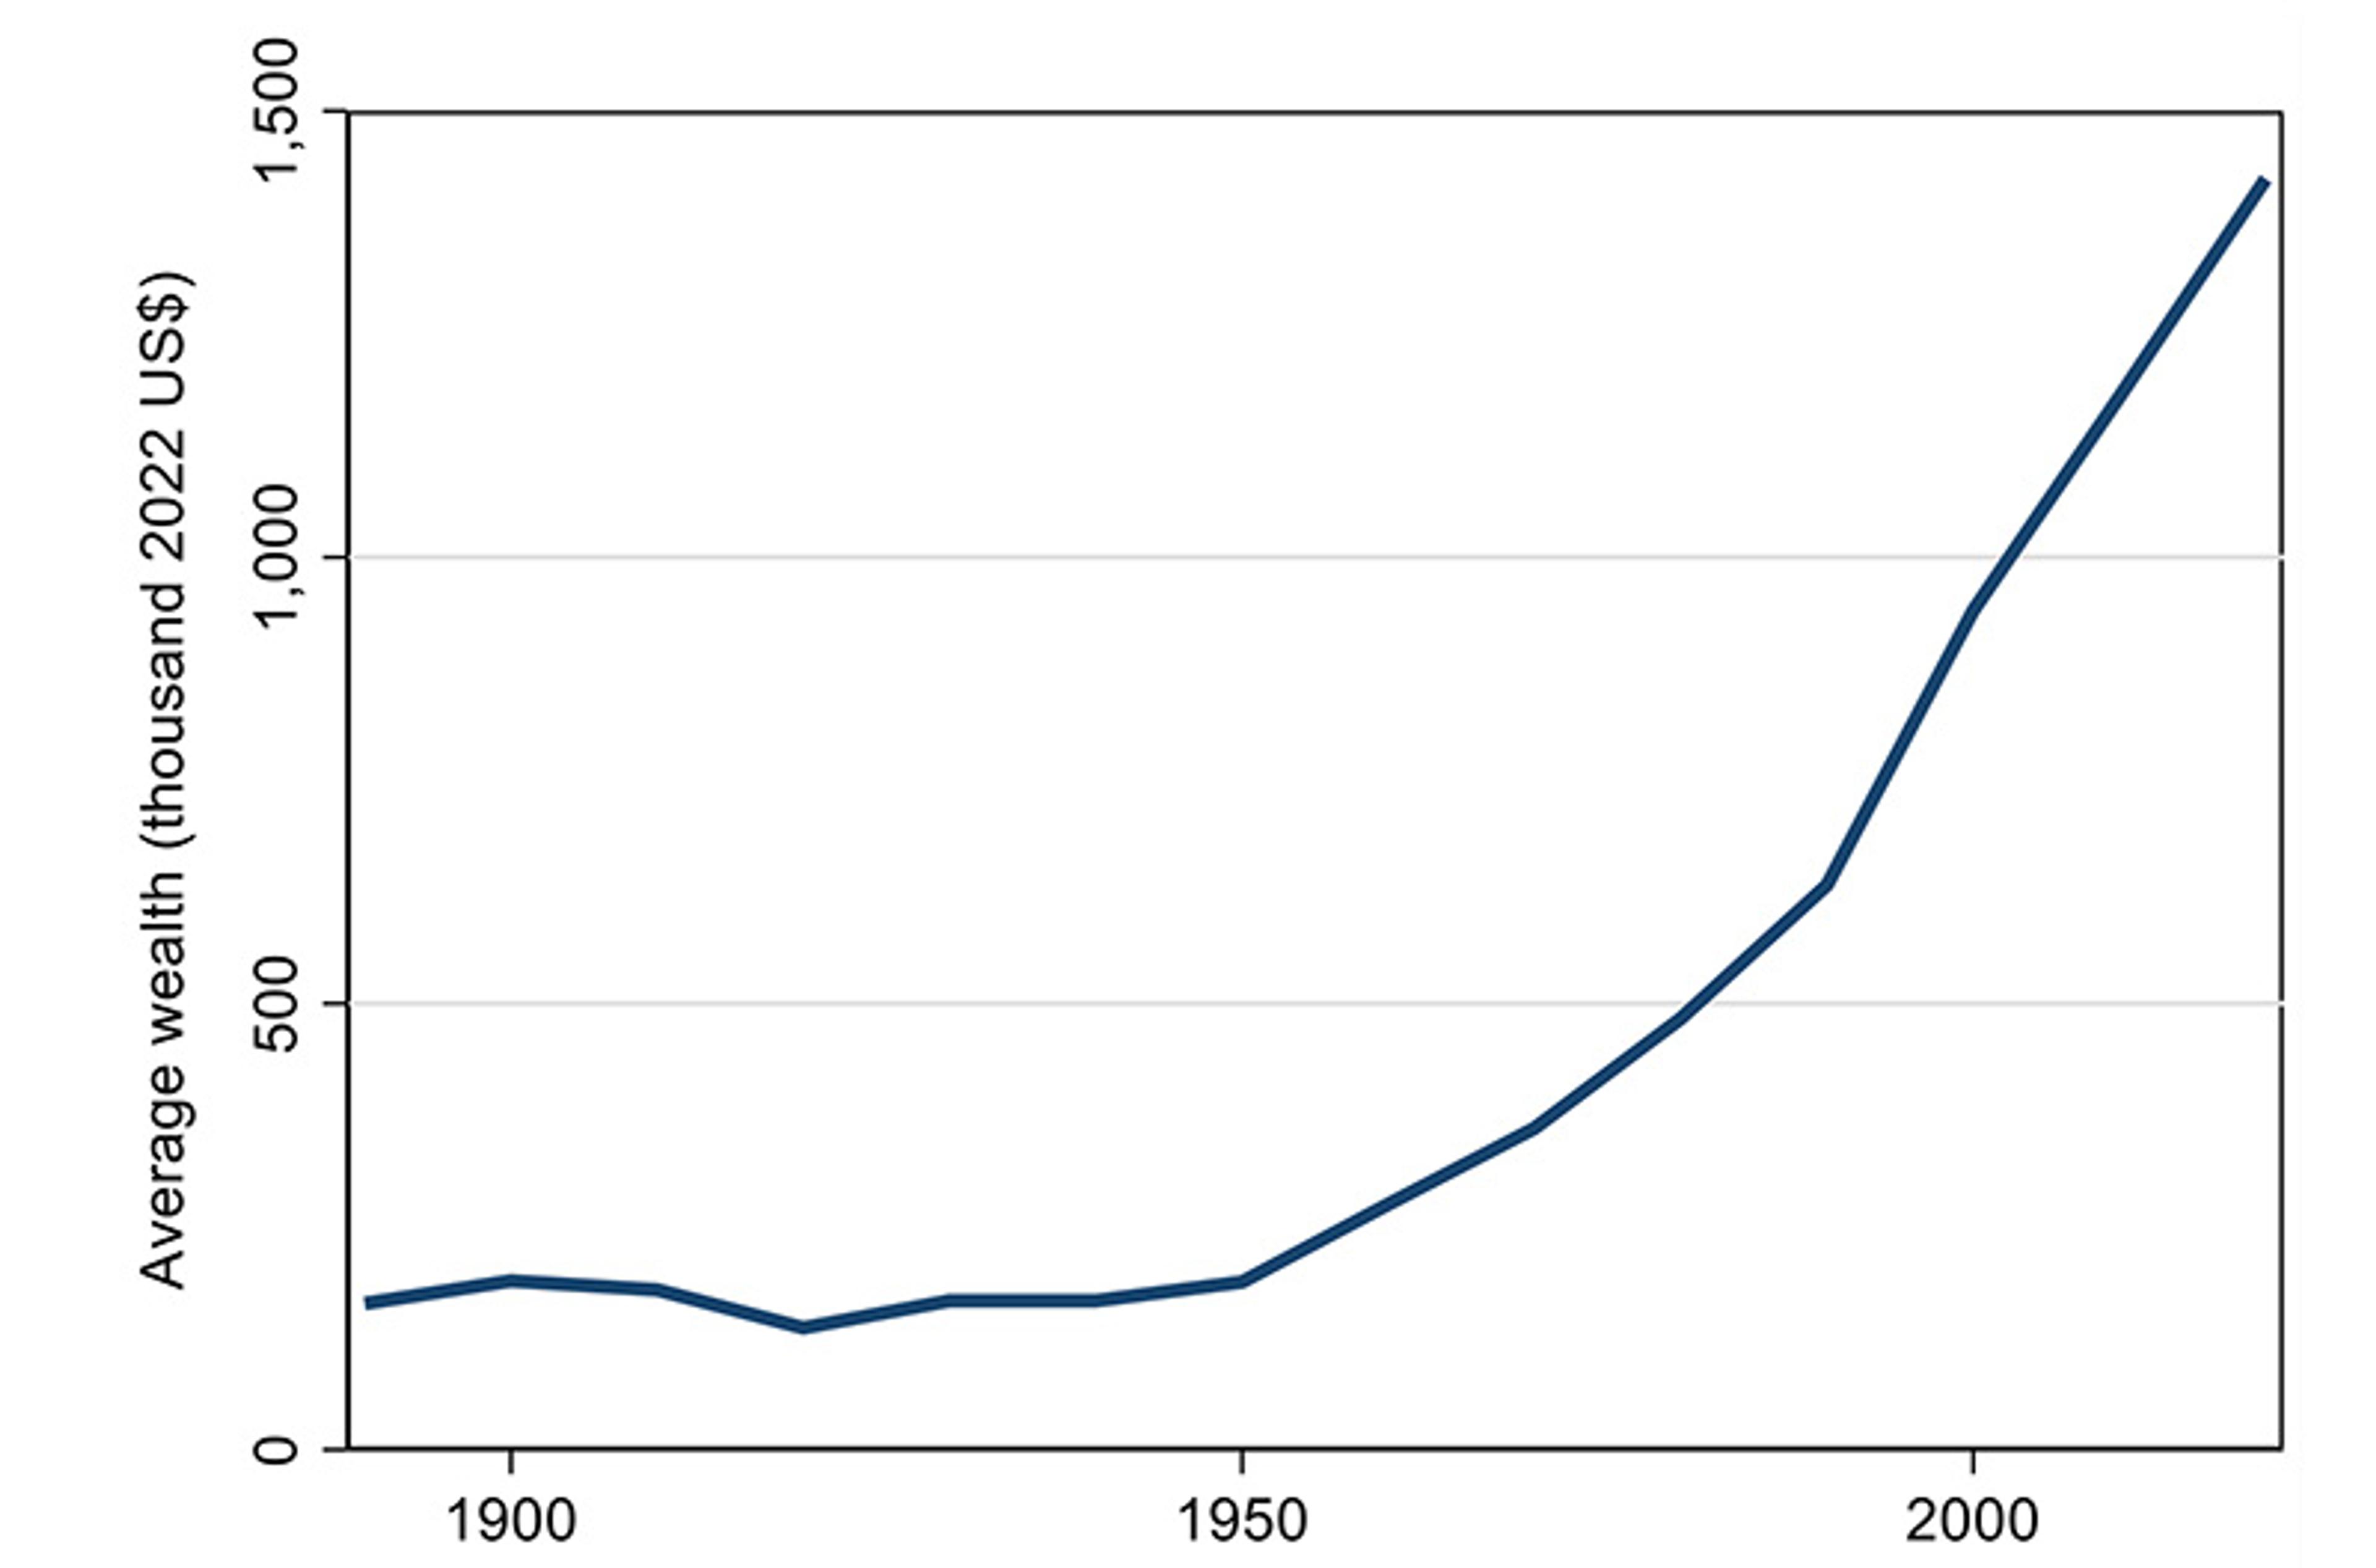
Figure 1: rising real average wealth in the Western world. Note: wealth is expressed in real terms, meaning that it is adjusted for the rise in consumer prices and thus expresses change in purchasing power. The line is an unweighted mean of the average wealth in the adult population in six countries (France, Germany, Spain, Sweden, the UK and the US) expressed in constant 2022 US dollars. Source: Waldenström (2024, Chapter 2)
A second fact coming out of the historical evidence is that wealth in the aggregate has changed in its appearance. The composition of assets people hold tells us about the economic structure of society and what functions wealth plays in the population. For example, whether most assets are tied to the agricultural economy or to industrial activities signifies the degree of economic modernisation in the historical analysis. The importance of ordinary people’s assets in the aggregate signifies the degree to which workers take part in the value-creation processes of the market economy. Figure 2 below displays the division across asset classes in the aggregate portfolio since the end of the 19th century. It is evident that, over the past 130 years, a monumental shift in wealth composition has taken place. A century ago, wealth comprised primarily agricultural land and industrial capital. Today, the majority of personal wealth is tied up in housing and pension funds.
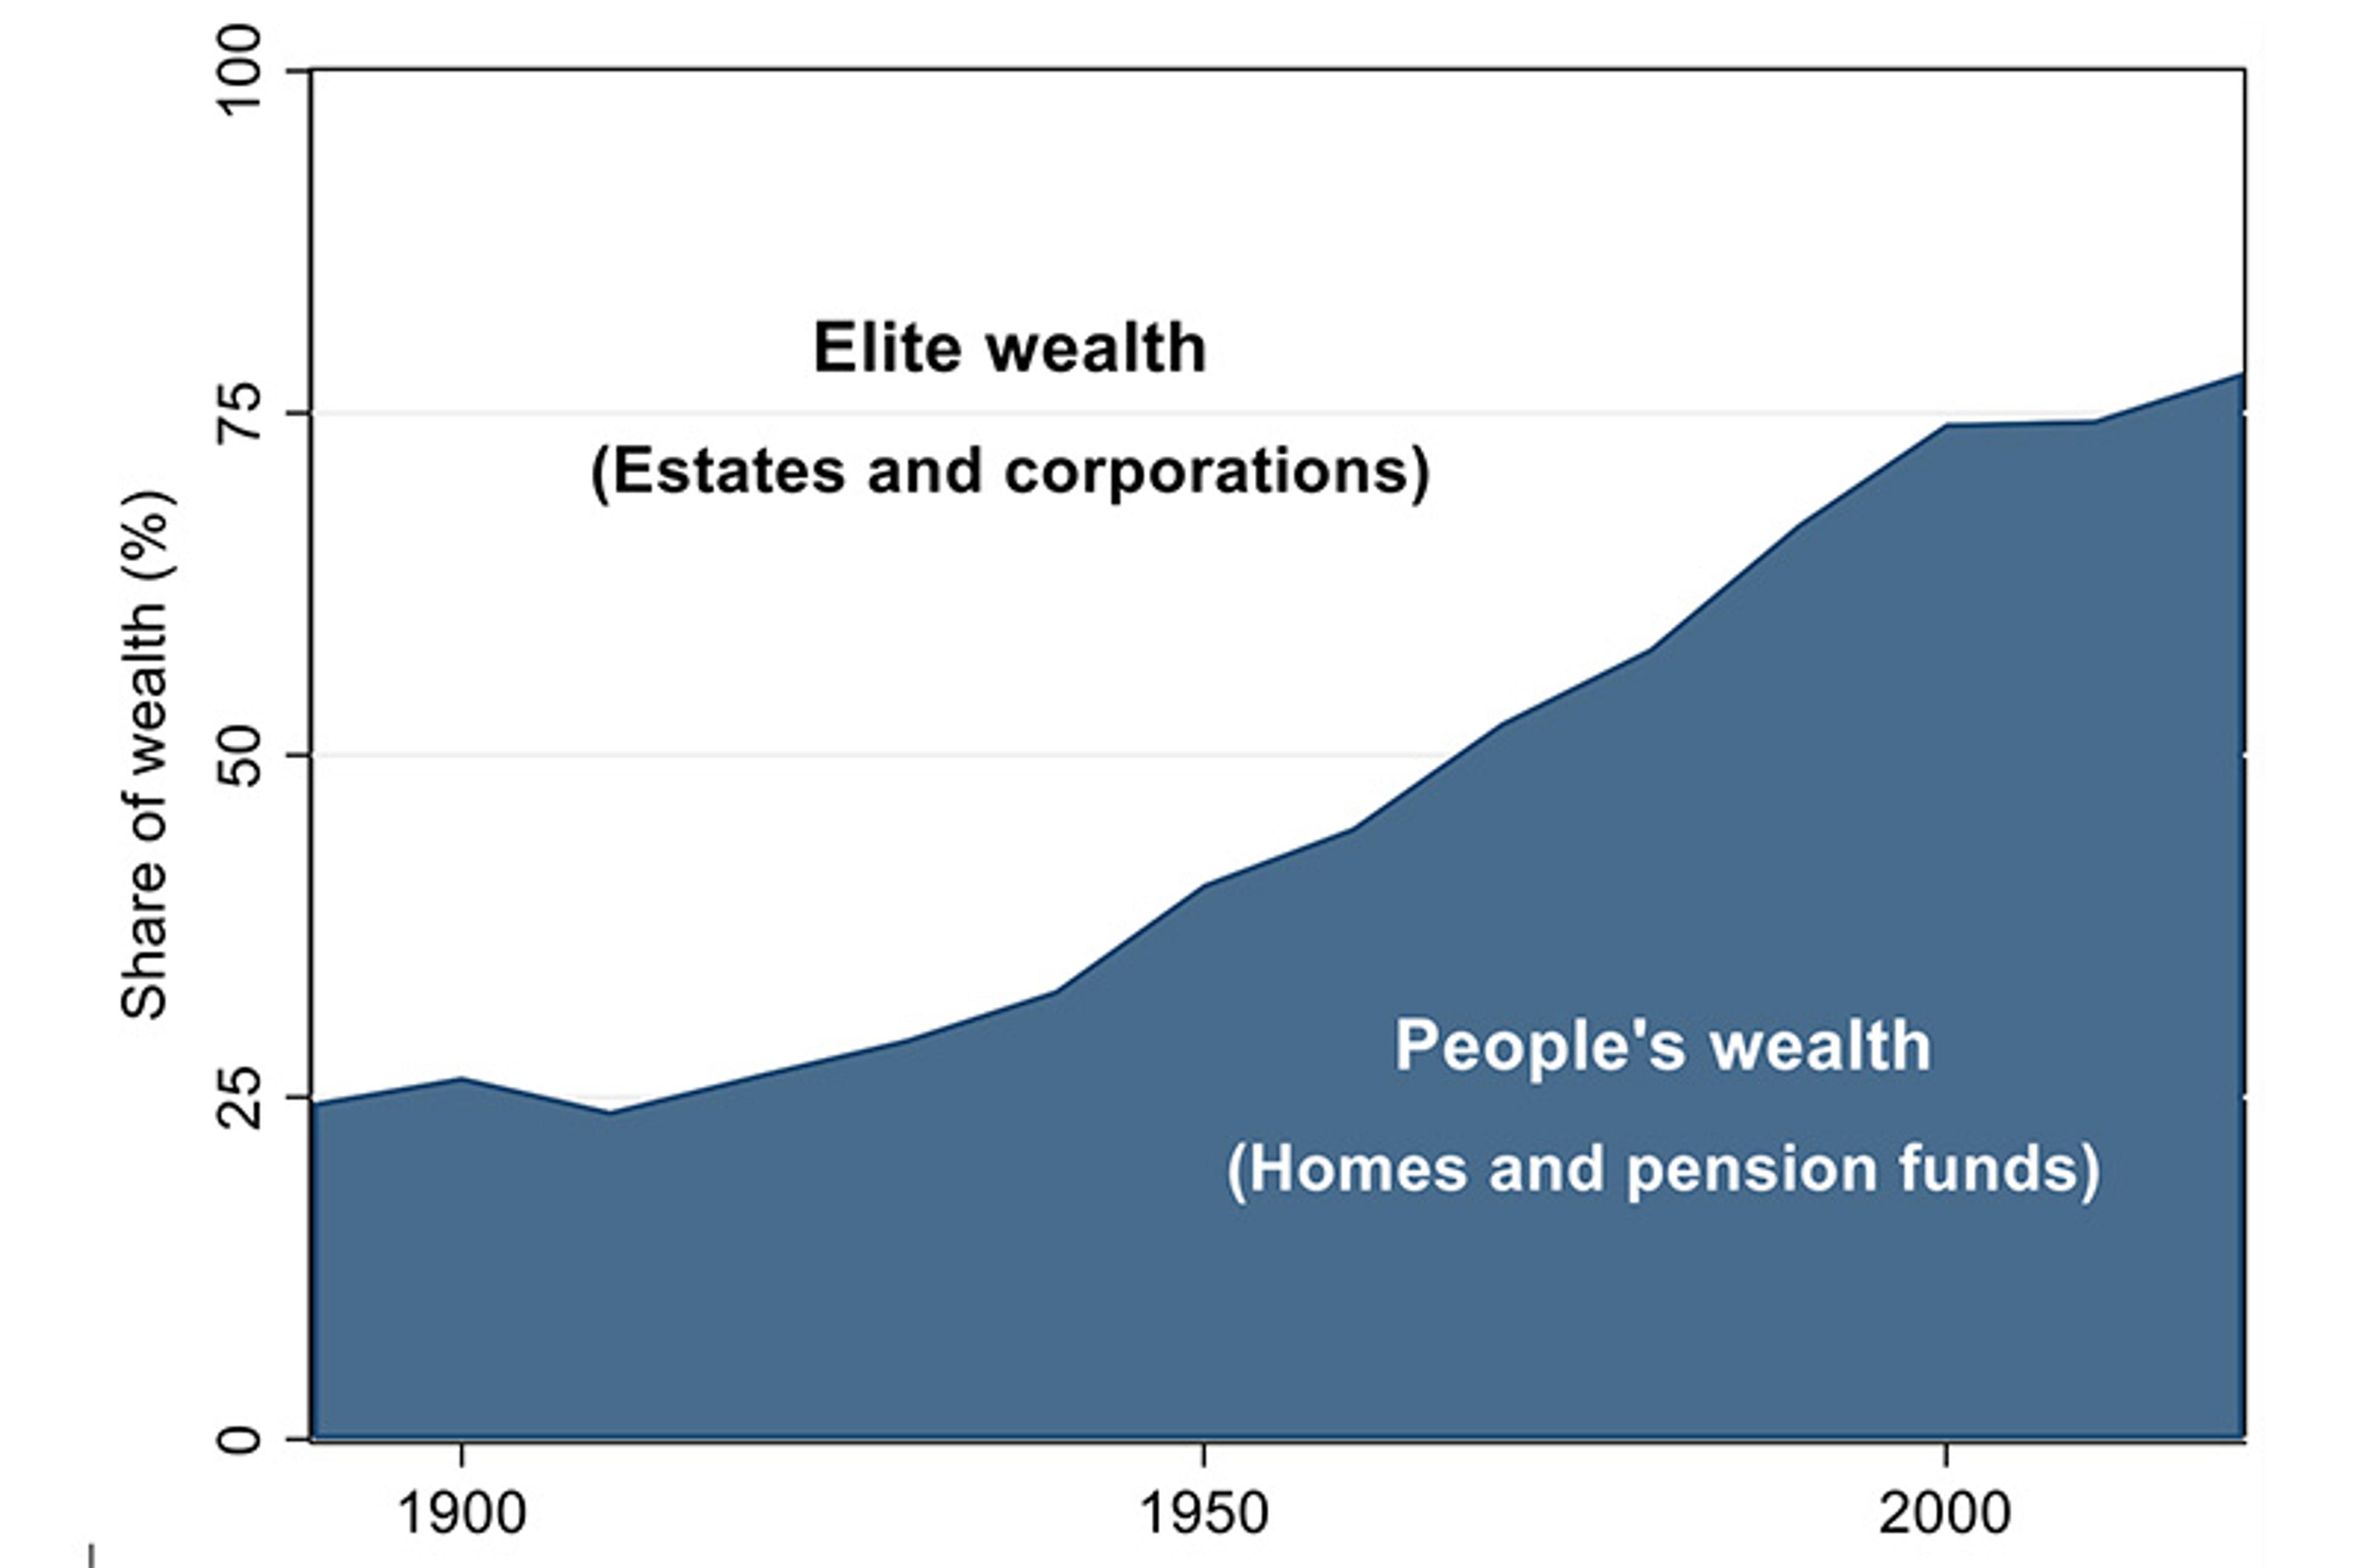
Figure 2: the aggregate composition of assets: from elite wealth to people’s wealth. Note: unweighted average of six countries (France, Germany, Spain, Sweden, the UK and the US). Source: Waldenström (2024, Chapter 3)
The transformation of wealth composition has strong distributional implications. Individual ownership data, often called microdata, show how ownership structures across wealth distribution bear a pattern of who owns what. Historically, the rich held agricultural estates and shares in industrial corporations. This is especially true over the long term of history, but it remains so now too. In contrast, the working population acquires wealth in their homes and long-term savings in pension funds. Homeownership rates today range from 50 to 80 per cent. Labor-force participation rates are even higher. In substance, this tells us that housing and work-related pension funds are assets that dominate the ownership of ordinary people in the lower and middle classes, which in turn links the relative aggregate importance of housing and pension funds for wealth inequality.
Looking closer at the relationship between the share of a country’s citizens who own their homes and the level of wealth inequality, the distributional pattern becomes evident. Figure 3 below plots countries according to their homeownership rates and wealth inequality, as measured by the common Gini coefficient that ranges from 0 (no inequality) to 1 (one individual owns everything), using recent wealth and homeownership surveys. Countries with higher levels of homeownership have lower wealth inequality. The straight line in the figure has a negative slope, which suggests that raising the homeownership rate by 10 points leads to an expected reduction in wealth inequality by 0.04 Gini points. As an example, France has a lower homeownership than Italy (60 per cent compared with 70 per cent), and a higher wealth inequality (0.67 versus Italy’s 0.61).
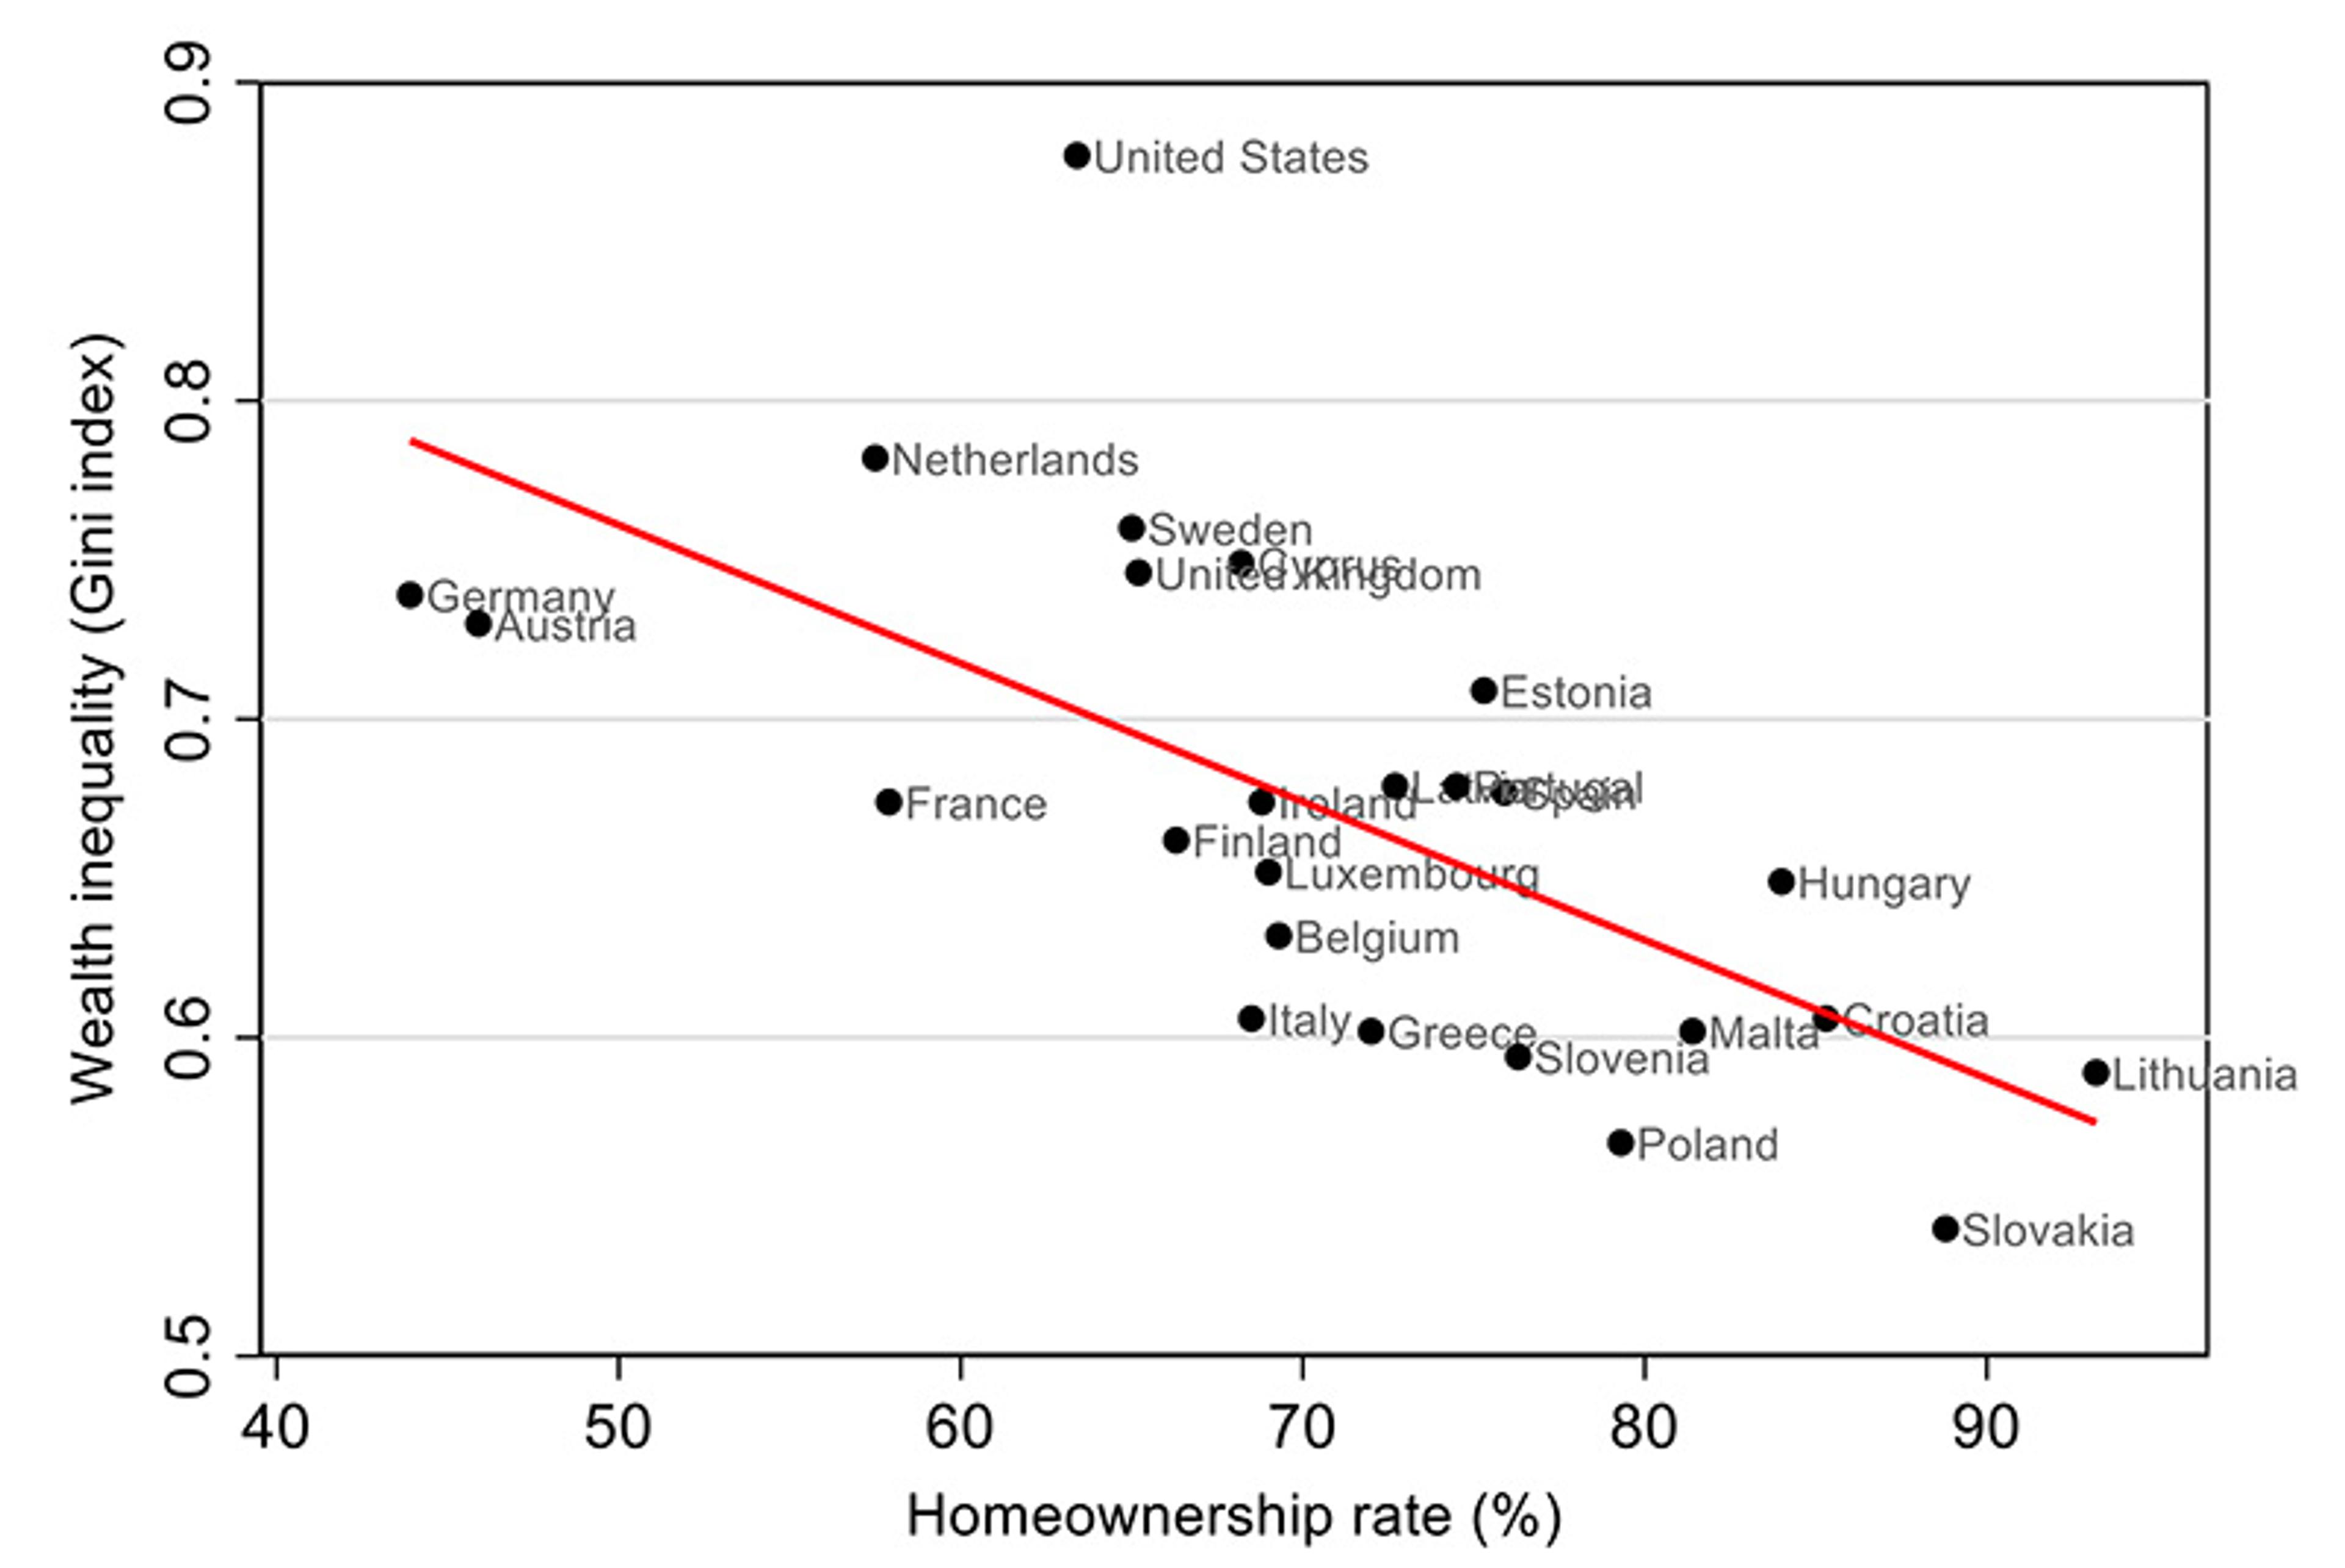
Figure 3: homeownership and wealth inequality in Europe and the US. Source: Waldenström (2024, Chapter 6)
The historical shift in the nature of wealth, from being elite-centric to more democratic, can thus be expected to have profound implications for the distribution of wealth. Figure 4 below presents the most recent data from European countries and the US. They reveal in graphical form how wealth inequality has decreased substantially over the past century. The wealthiest percentile once held around 60 per cent of all wealth. The share ranged from 50 per cent of wealth in the US and Germany to 70 per cent in the UK.
Most wealth today is in homes and pensions, assets predominantly of low- and middle-wealth households
Since the first half of the 20th century, the tide has turned. A great wealth equalisation took place throughout the Western world. From the 1920s to the 1970s, wealth concentration fell steadily. In the 1970s, wealth equalisation stopped, but then Europe and the US follow separate paths. In Europe, top wealth shares stabilise at historically low levels, perhaps with a slight increasing tendency. As of 2010, the richest 1 per cent in society holds a share of total wealth at around 20 per cent in Europe. That is roughly one-third of its share of national wealth from a century earlier. Countries like the UK, the Netherlands, Italy and Finland have top percentile shares of around 16-18 per cent. A bit higher are countries like Spain, Denmark, Norway and Sweden with top shares at around 21-24 per cent. Germany has an even higher share, around 27 per cent, and Switzerland’s richest percentile group owns about 30 per cent of all wealth.
This stability of post-1970 top wealth shares may seem contradictory when contrasted with the large increases in aggregate wealth values over recent decades. However, it is consistent with most of the asset ownership patterns documented above, with most of wealth today being in housing and pensions, assets predominantly held by low- and middle-wealth households.
The US wealth concentration experience is somewhat different. Wealth inequality in the beginning of the 20th century was somewhat lower in the US than in most European countries, perhaps reflecting being a younger nation with less established elite structures. The equalisation trend also happened in the US, but it was less pronounced than in Europe. Today, US wealth concentration is currently much higher than in Europe. This situation, as the figure below shows, is the result of several years of steady increase. In historical perspective, however, even the current US level of wealth inequality is lower than it was before the Second World War, and it pales in comparison with the extreme levels of wealth concentration that the people of Europe experienced 100 years ago.
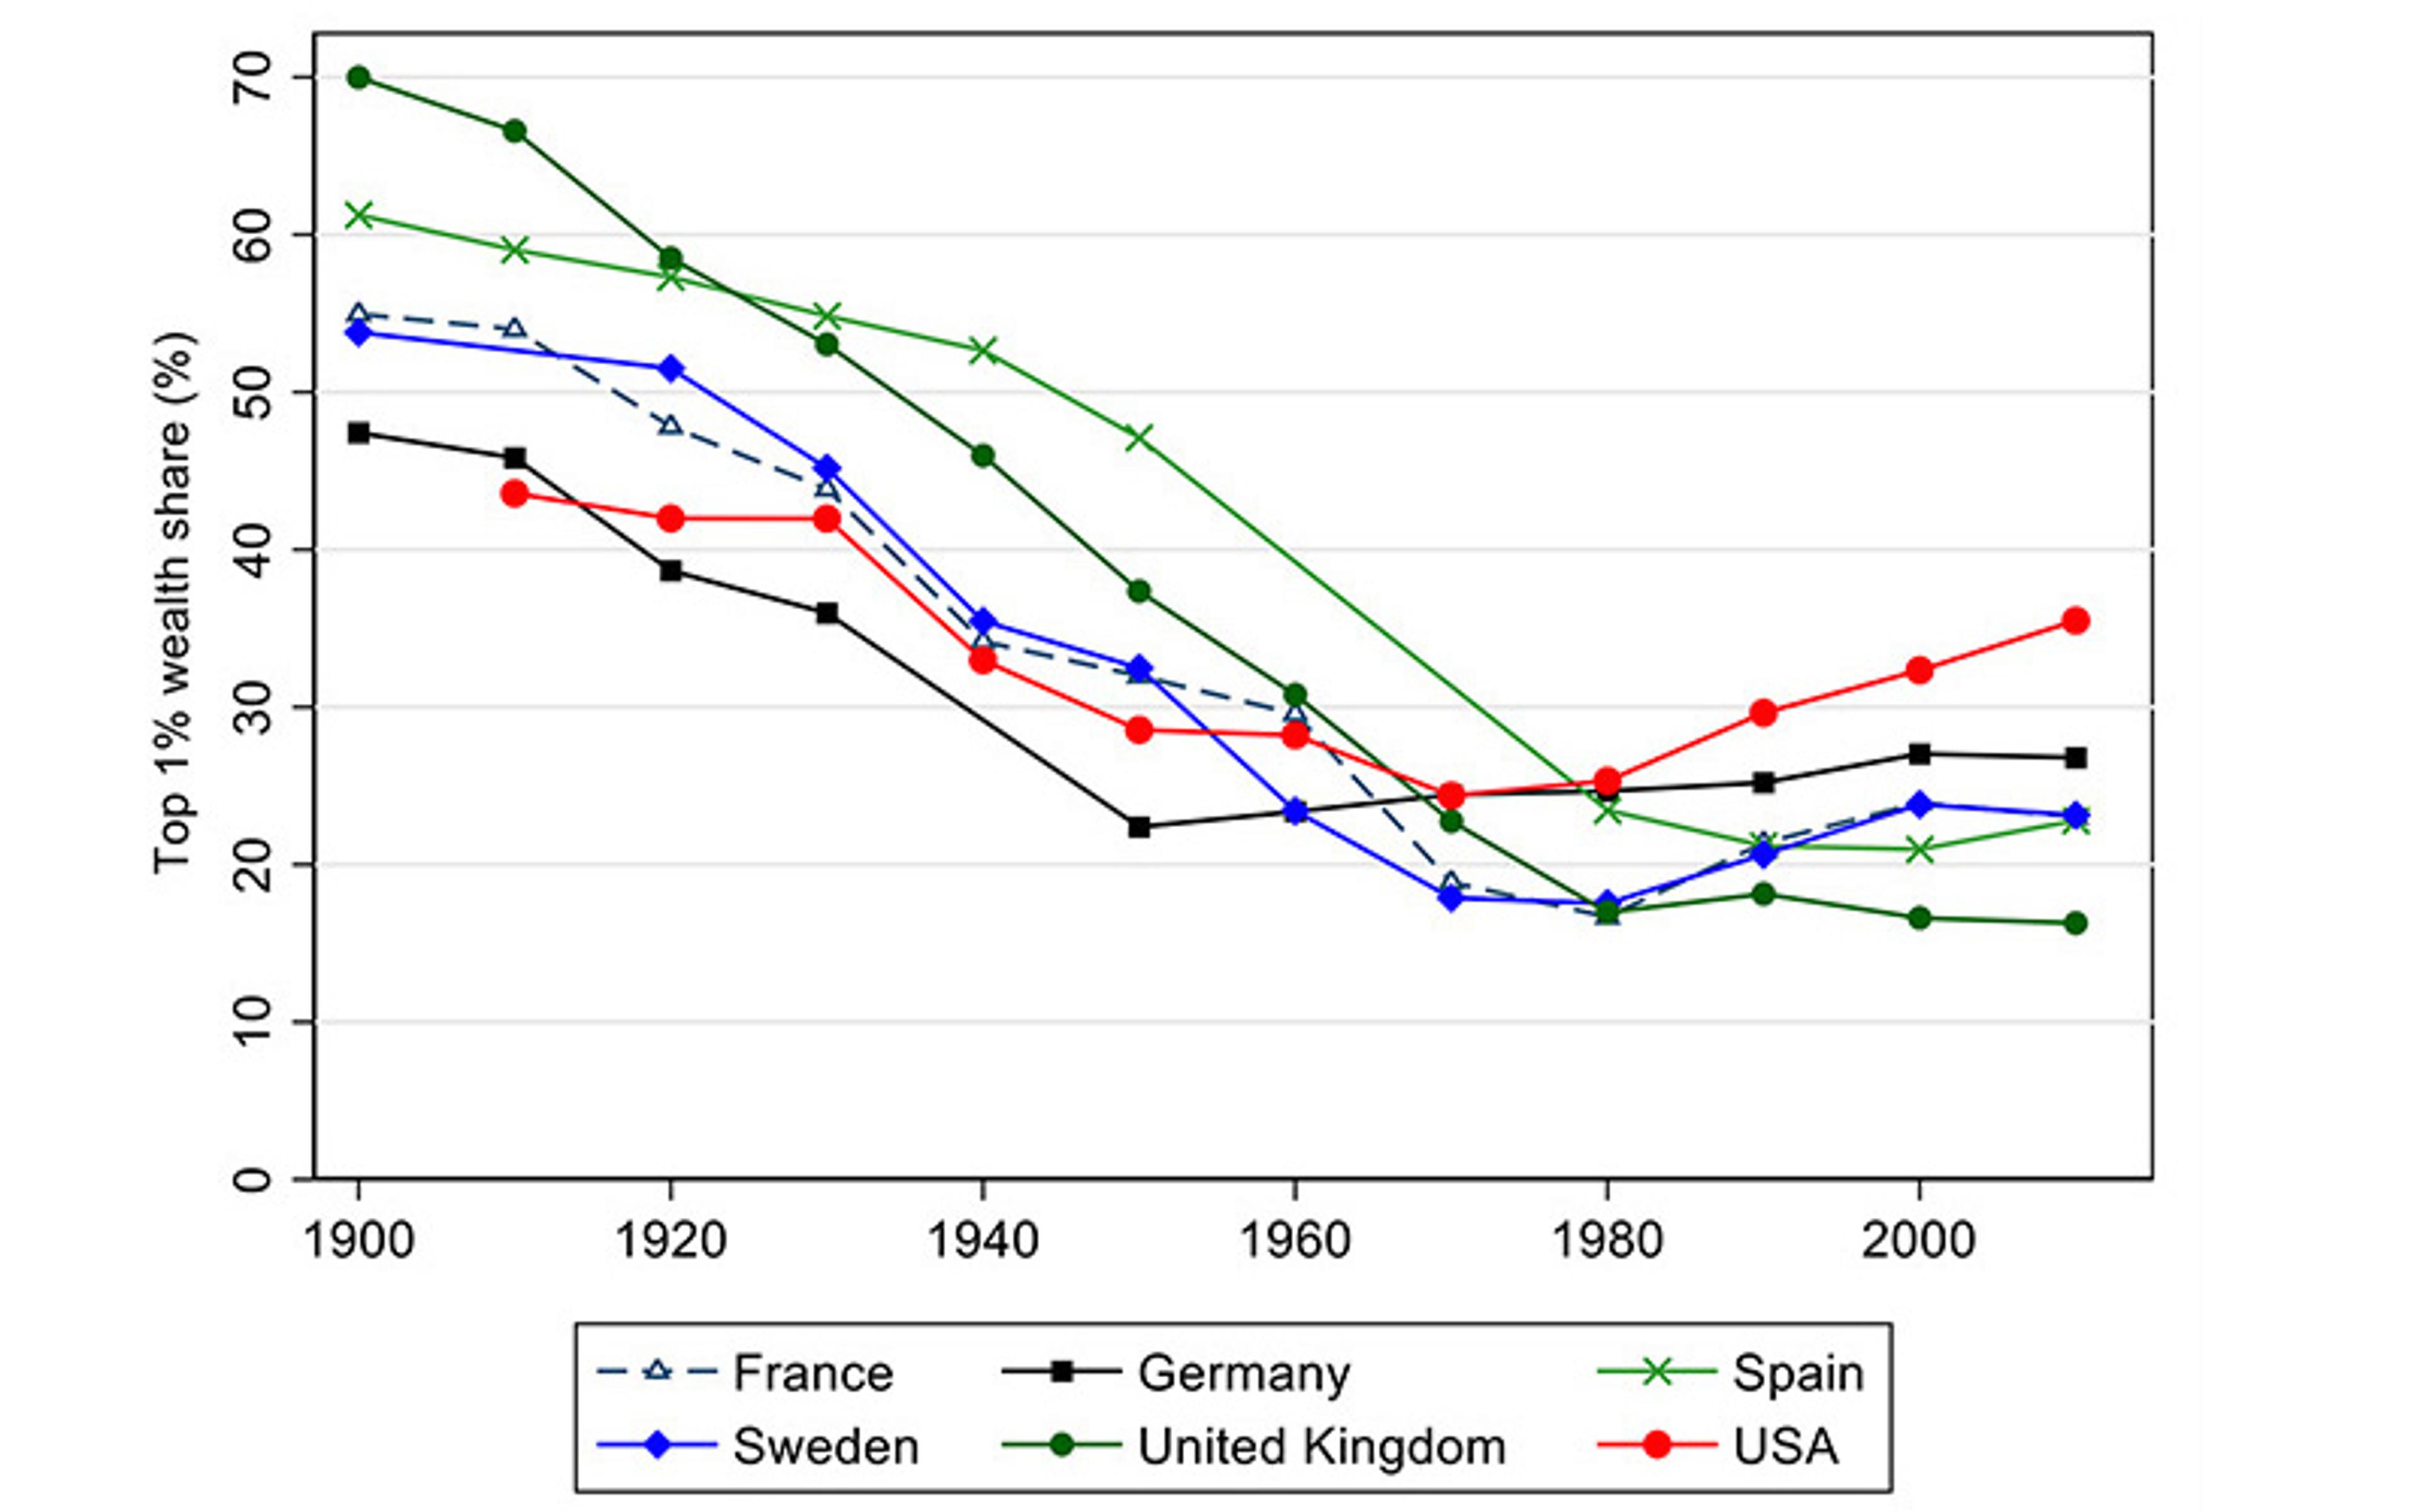
Figure 4: the great wealth equalisation over the 20th century. Source: Waldenström (2024, Chapter 5)
How can we account for these historical trends showing a steady growth in average household wealth and, at the same time, wealth inequality falling to historically low levels, where it has remained in Europe but has risen lately in the US? One approach is to break down the top wealth shares into the accumulation of wealth in the top and bottom groups of the distribution. In other words, we decompose the change in top wealth shares by documenting the changes in absolute wealth holdings in the numerator and denominator of the top wealth-share ratio. Figure 5 below shows these numbers, and they are striking.
During no historical time period during the past century did the wealth amounts of the rich fall on average. The falling wealth concentration from 1910 to 1980 was instead the result of wealth accumulating faster in the middle classes than in the top. Since 1950, wealth holdings have actually grown in the entire population. Between 1950 and 1980, it grew faster among the lower groups in the wealth distribution, explaining the continued equalisation. After 1980, wealth has instead grown faster in the top percentile than in the lower classes, which accounts for the halt of the long equalisation trend and a slight upward trend in the top wealth share, driven by the US development, whereas the European countries remained at its historically low levels.
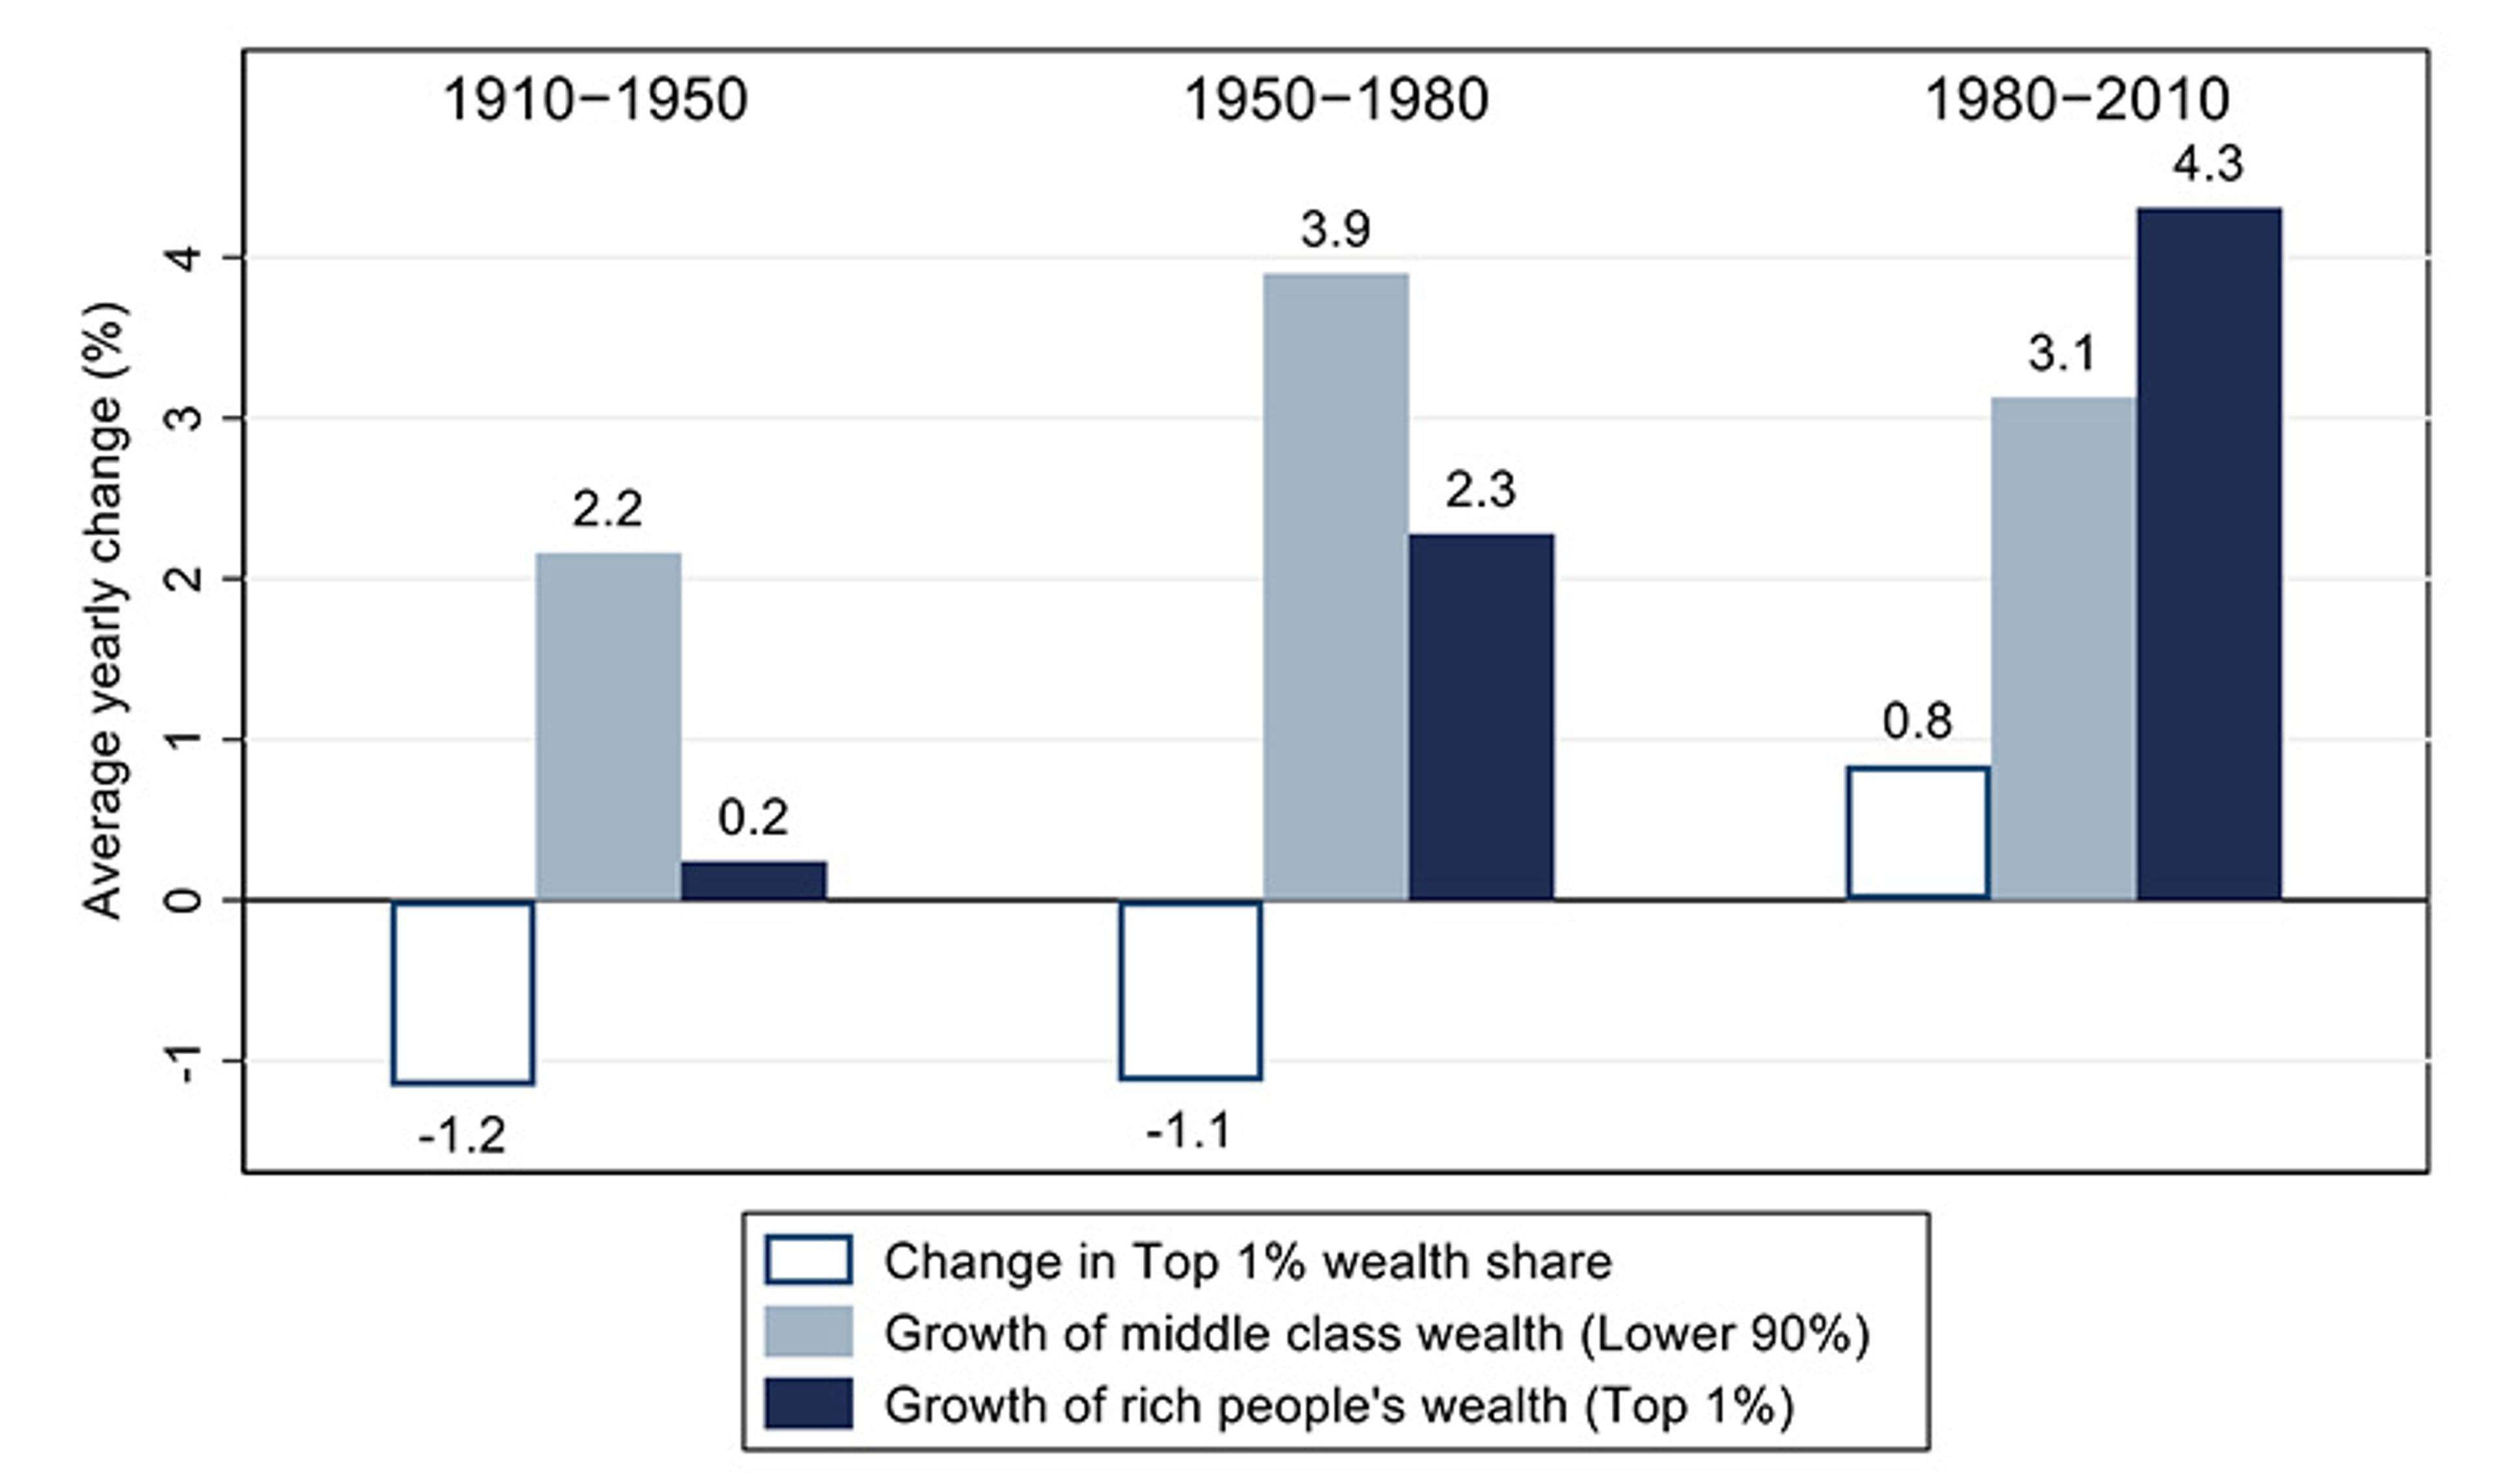
Figure 5: Western wealth growth: the middle class vs the rich. The graph shows a six-country average (France, Germany, Spain, Sweden, the UK, the US) of the average annual growth rate of real (inflation-adjusted) net wealth per adult individual in the top 1 per cent and the lower 90 per cent of the wealth distribution during three time periods. Source: Waldenström (2024, Chapter 6)
Looking at the specific factors that could account for these trends in wealth growth and wealth inequality, there are some that match the evidence better than others. According to the orthodox narrative, the main explanation was the shocks to capital during the world wars and postwar capital taxes, all of which are believed to have created equality through lowering the top of the wealth distribution. In this telling, the physical capital destruction in wars reduced the fortunes of the rich, and the immediate postwar hikes in capital taxes and market regulations, such as price controls and capital market restrictions, prevented the entrepreneurs from rebuilding their wealth.
Wealth and inheritance taxes reached almost confiscatory levels in the early 1970s
However, the thesis has some issues. One is that the evidence shows little difference between belligerent and non-belligerent countries. During both wars, the wealth share of the top 1 per cent fell equally in belligerent countries like France and the UK as in non-belligerent Sweden. Including the immediate postwar years, which were heavily influenced by wartime turbulence, does not change this pattern. Germany’s data from the wars is less clear, but it appears that the country experienced larger losses than others, reducing top wealth shares. Spain, which stayed out of both world wars but fought a civil war in the 1930s, saw the wealth share of the richest 1 per cent remain virtually unchanged between 1936 and 1939, according to preliminary estimates. Looking at the US, top wealth shares fell during both wars.
Analysing instead the changes in absolute wealth held by the rich and by the rest reinforces the conclusion that wars were not a devastating moment for capital owners. In fact, the fortunes of the elite did not shrink significantly, except in France during the First World War and seemingly in Germany during both wars. In other cases, the capital values of the rich remained almost constant, and the wealth equalisation observed can be attributed to growing ownership among groups below the top tier.
Progressive tax policies after the Second World War offer another potential explanation for the wealth-equalisation trend. Capital taxation increased rapidly between the 1950s and the 1980s in most Western countries. Wealth and inheritance taxes reached almost confiscatory levels in the early 1970s, and this coincided with stagnating business activities, few startups, slowed economic growth, and an exodus of prominent entrepreneurs from high- to low-tax countries. Few studies have been able to analyse systematically the extent to which these taxes prevented the rise of new large fortunes, but studies of later periods suggest that there are good grounds to believe they did.
A general problem for the factors above – which focus on shocks to the capital of the rich and thus lowering the top of wealth distribution as the primus motor behind the great wealth equalisation of the 20th century – is that the evidence presented in Figure 5 above shows that it was instead the lifting of the bottom of the distribution that accounted for the equalisation. Let us therefore shift focus and examine the two main channels through which this happened: the accumulation of homeownership and saving for retirement.
At the turn of the 20th century, owning a decent home and saving for retirement were luxuries enjoyed by only a select few – maybe a couple of tens of millions in Western countries. Today, the once-elusive dreams of home ownership and pensions have become a reality for several hundreds of millions of people. Homeownership rates went from 20-40 per cent in the first half of the former century to 50-80 per cent in the modern era. Retirement savings also increased in the postwar period, reflecting the longer life spans that came with the general improvement of living standards. Funded pensions and other insurance savings comprised 5-10 per cent of household portfolios around 1950, but this share increased to 20-40 per cent in the 2000s.
The most crucial equalisation resulted from expanded wealth ownership among ordinary citizens
History demonstrates that the significant wealth equalisation over the past century was primarily driven by a massive increase in homeownership and retirement savings. But what initiated this accumulation of assets by households? The most comprehensive evidence highlights the role of political changes and economic developments that explicitly included new groups in the productive market economy. Firstly, the 1910s and ’20s witnessed a broad wave of political democratisation, extending universal suffrage to the Western world. Following this regime shift, a series of reforms transformed the economic reality for the masses. Educational attainment was expanded, and higher education became accessible to broader segments of society. New labour laws improved workers’ rights, making workplaces safer and reducing working hours. These changes enhanced workers’ productivity and real incomes. Simultaneously, the financial system evolved by offering better services to this new constituency of potential customers, including cheaper loans, savings plans, mutual funds and other financial services.
Thus, the primary drivers behind the great wealth equalisation of the 20th century were not wars or the redistributive effects of capital taxation. While these factors had some impact, the most crucial equalisation resulted from expanded wealth ownership among ordinary citizens, particularly through homeownership and pension savings, and the institutional shifts that enabled the accumulation of these assets.
A general lesson from history is that wealth accumulation is a positive, welfare-enhancing force in free-market economies. It is closely linked to the growth of successful businesses, which leads to new jobs, higher incomes and more tax revenue for the public sector. Various historical, social and economic factors have contributed to the rise of wealth accumulation in the middle class, with homeownership and pension savings being the primary ones.
As a closing remark, it should be recognised that the story of wealth equalisation is not one of unmitigated success. There are still significant disparities in wealth within and among nations, generating instability and injustice. Over the past years, wealth concentration has increased in some countries, most notably in the US. The extent to which this is due to productive entrepreneurship generating products, jobs, incomes and taxes, or to forces that exclude groups from acquiring personal wealth causing tensions and erosive developments in society, is a question that needs to be studied more. However, at this point it is still vital to acknowledge the progress toward greater equality that has been made in our past and understand how it has happened. Only then can we be in a stronger position to lay the foundation for further advancements in our quest for a more just and prosperous world.


