I have billions of pixels in my cellphone, and you probably do too. But what is a pixel? Why do so many people think that pixels are little abutting squares? Now that we’re aswim in an ocean of zettapixels (21 zeros), it’s time to understand what they are. The underlying idea – a repackaging of infinity – is subtle and beautiful. Far from being squares or dots that ‘sort of’ approximate a smooth visual scene, pixels are the profound and exact concept at the heart of all the images that surround us – the elementary particles of modern pictures.
This brief history of the pixel begins with Joseph Fourier in the French Revolution and ends in the year 2000 – the recent millennium. I strip away the usual mathematical baggage that hides the pixel from ordinary view, and then present a way of looking at what it has wrought.
The millennium is a suitable endpoint because it marked what’s called the great digital convergence, an immense but uncelebrated event, when all the old analogue media types coalesced into the one digital medium. The era of digital light – all pictures, for whatever purposes, made of pixels – thus quietly began. It’s a vast field: books, movies, television, electronic games, cellphones displays, app interfaces, virtual reality, weather satellite images, Mars rover pictures – to mention a few categories – even parking meters and dashboards. Nearly all pictures in the world today are digital light, including nearly all the printed words. In fact, because of the digital explosion, this includes nearly all the pictures ever made. Art museums and kindergartens are among the few remaining analogue bastions, where pictures fashioned from old media can reliably be found.
Almost everyone in the sciences and technologies knows Fourier. We use his great wave idea every day. But most know very little about the man himself. Few are aware that he was almost guillotined for his role in the French Revolution in the 1790s. Or that he went to Egypt with Napoleon Bonaparte in the expedition that revealed the Rosetta Stone. Or that Napoleon exiled him to Grenoble to keep him – or, more importantly, his knowledge of Napoleon’s military embarrassments in Egypt – out of Paris. While in exile, he mastered his great musical idea. Only when Napoleon himself was finally exiled to St Helena could Fourier return to Paris.
It’s common knowledge that music is a sum of sound waves of different frequencies (pitches) and amplitudes (loudnesses). It was Fourier who taught us that all audio is made up of waves too. He taught us that a one-dimensional (1D) signal, such as a sequence of sounds, is a sum of beautiful regular waves, like those in Figure 1 below:
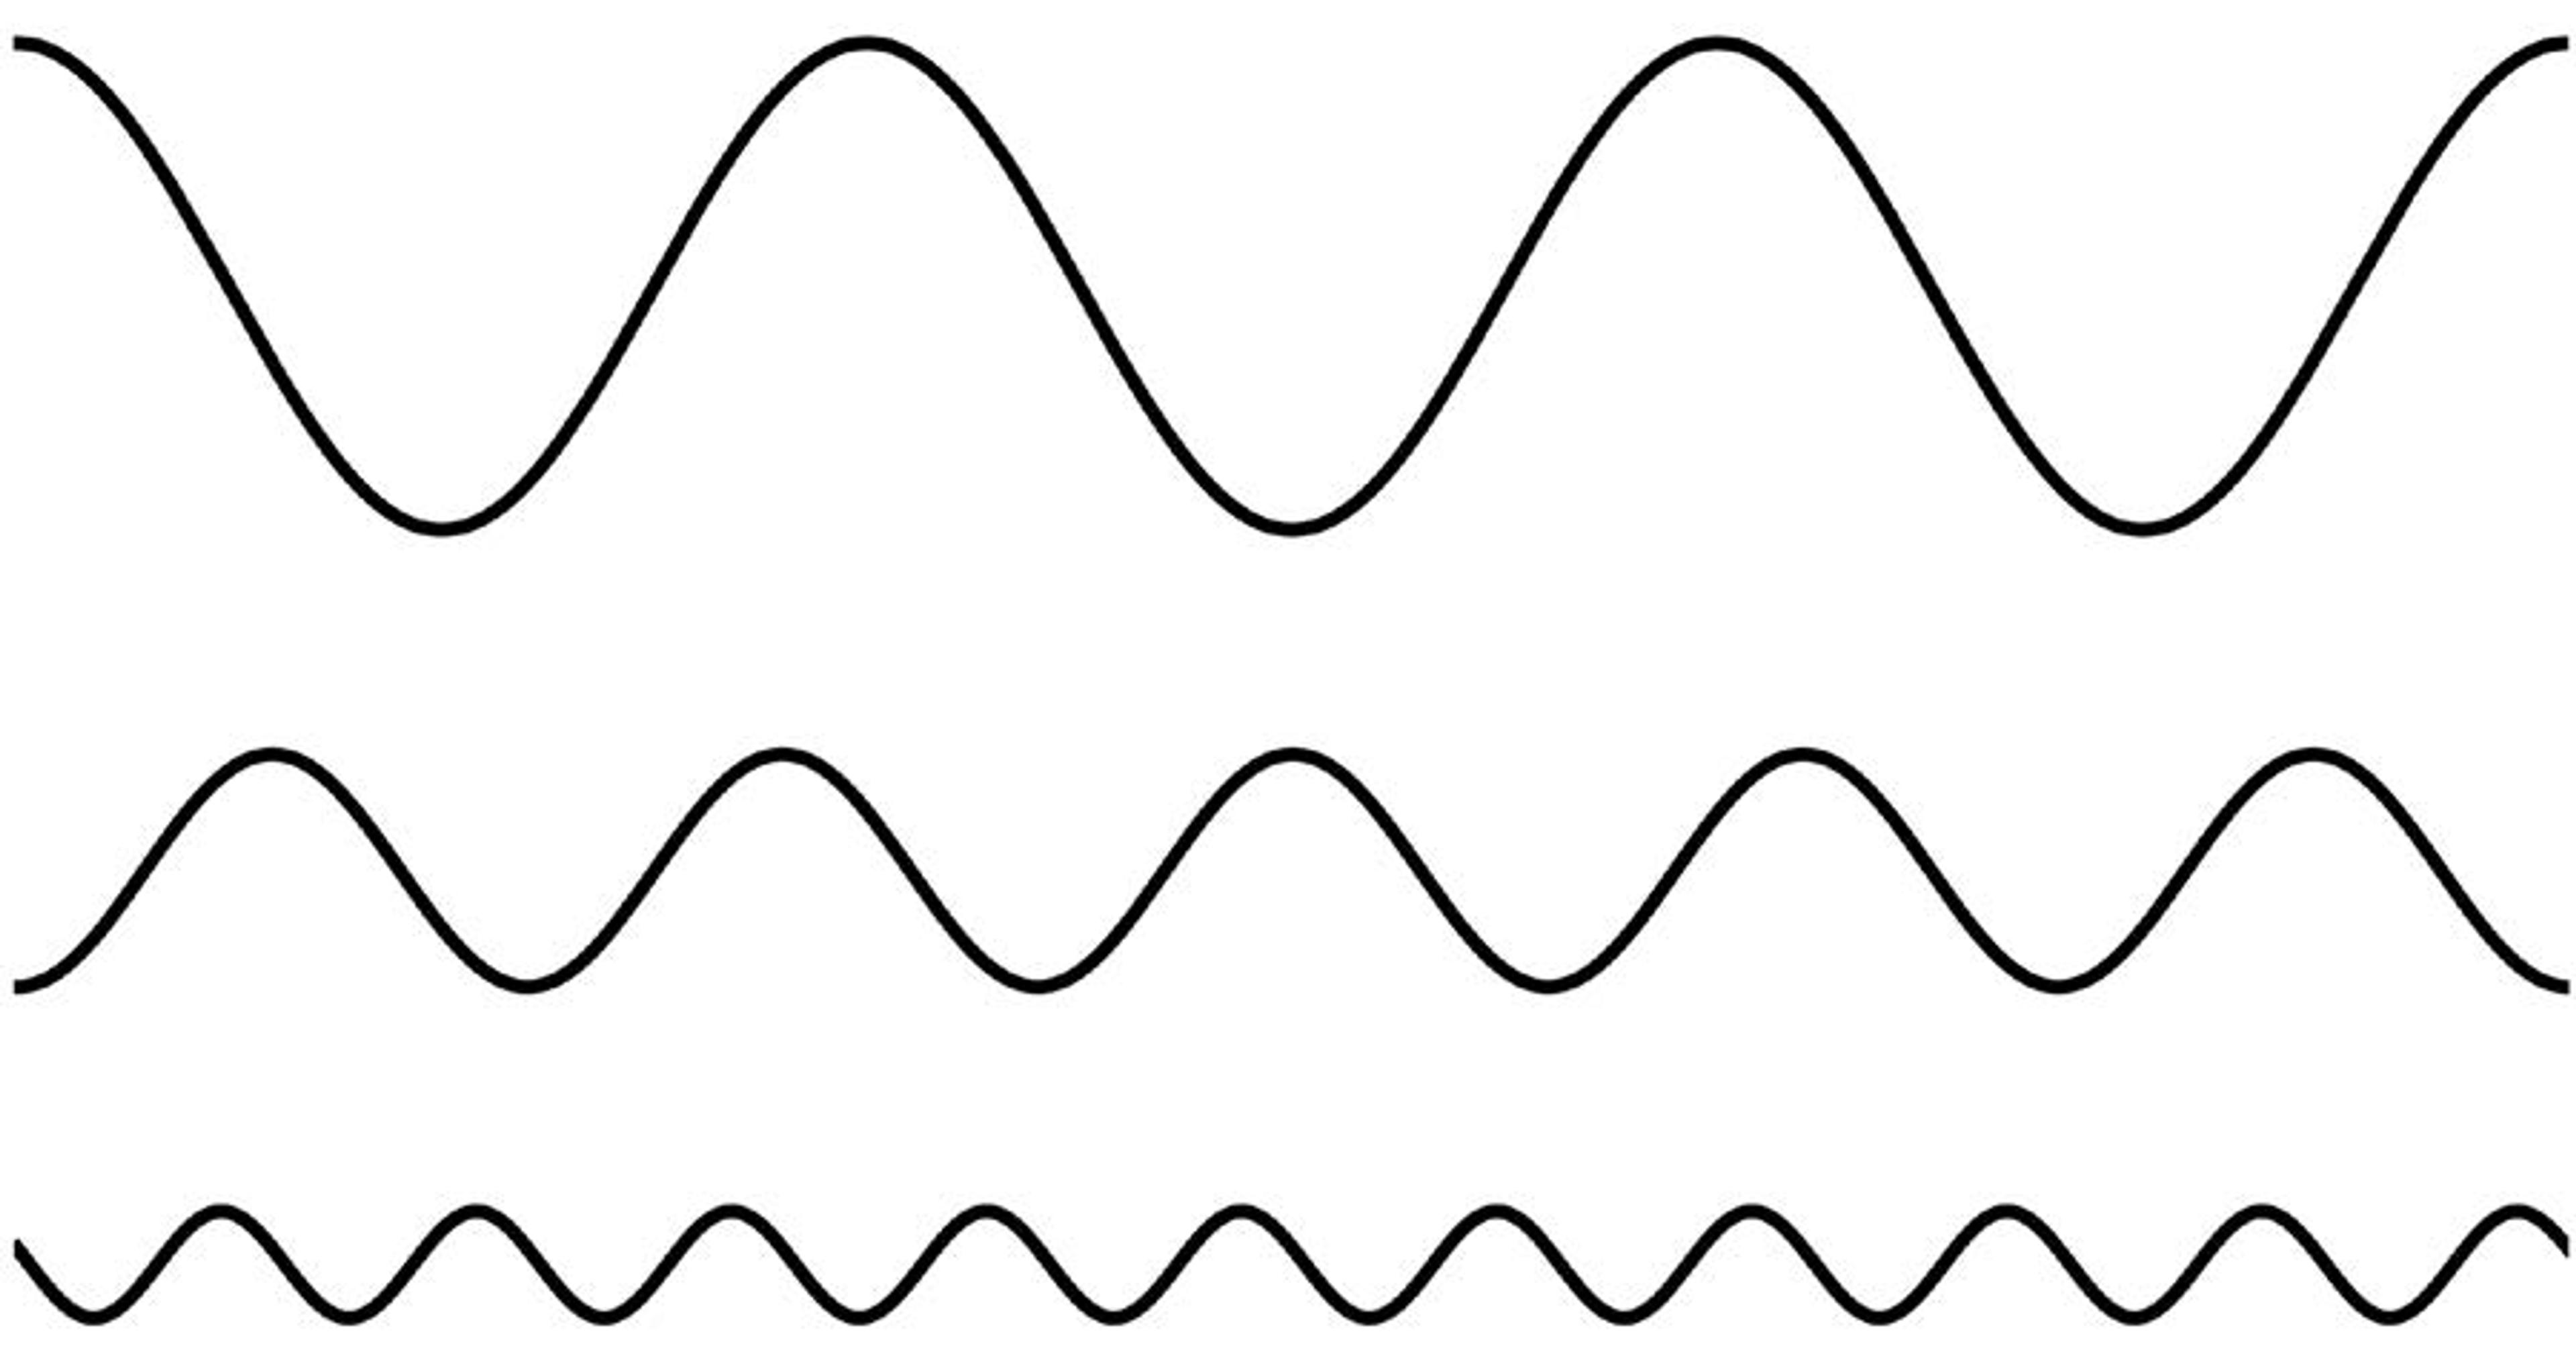
Figure 1
Importantly for the pixel, Fourier taught us that a two-dimensional (2D) signal – a picture, say – is also a sum of regular waves, like those in Figure 2 below. They are 1D waves extruded out of the page and viewed from above the ripples. Fourier told us that you can add such corrugations together to get any picture – of your child, for example. It’s all music.
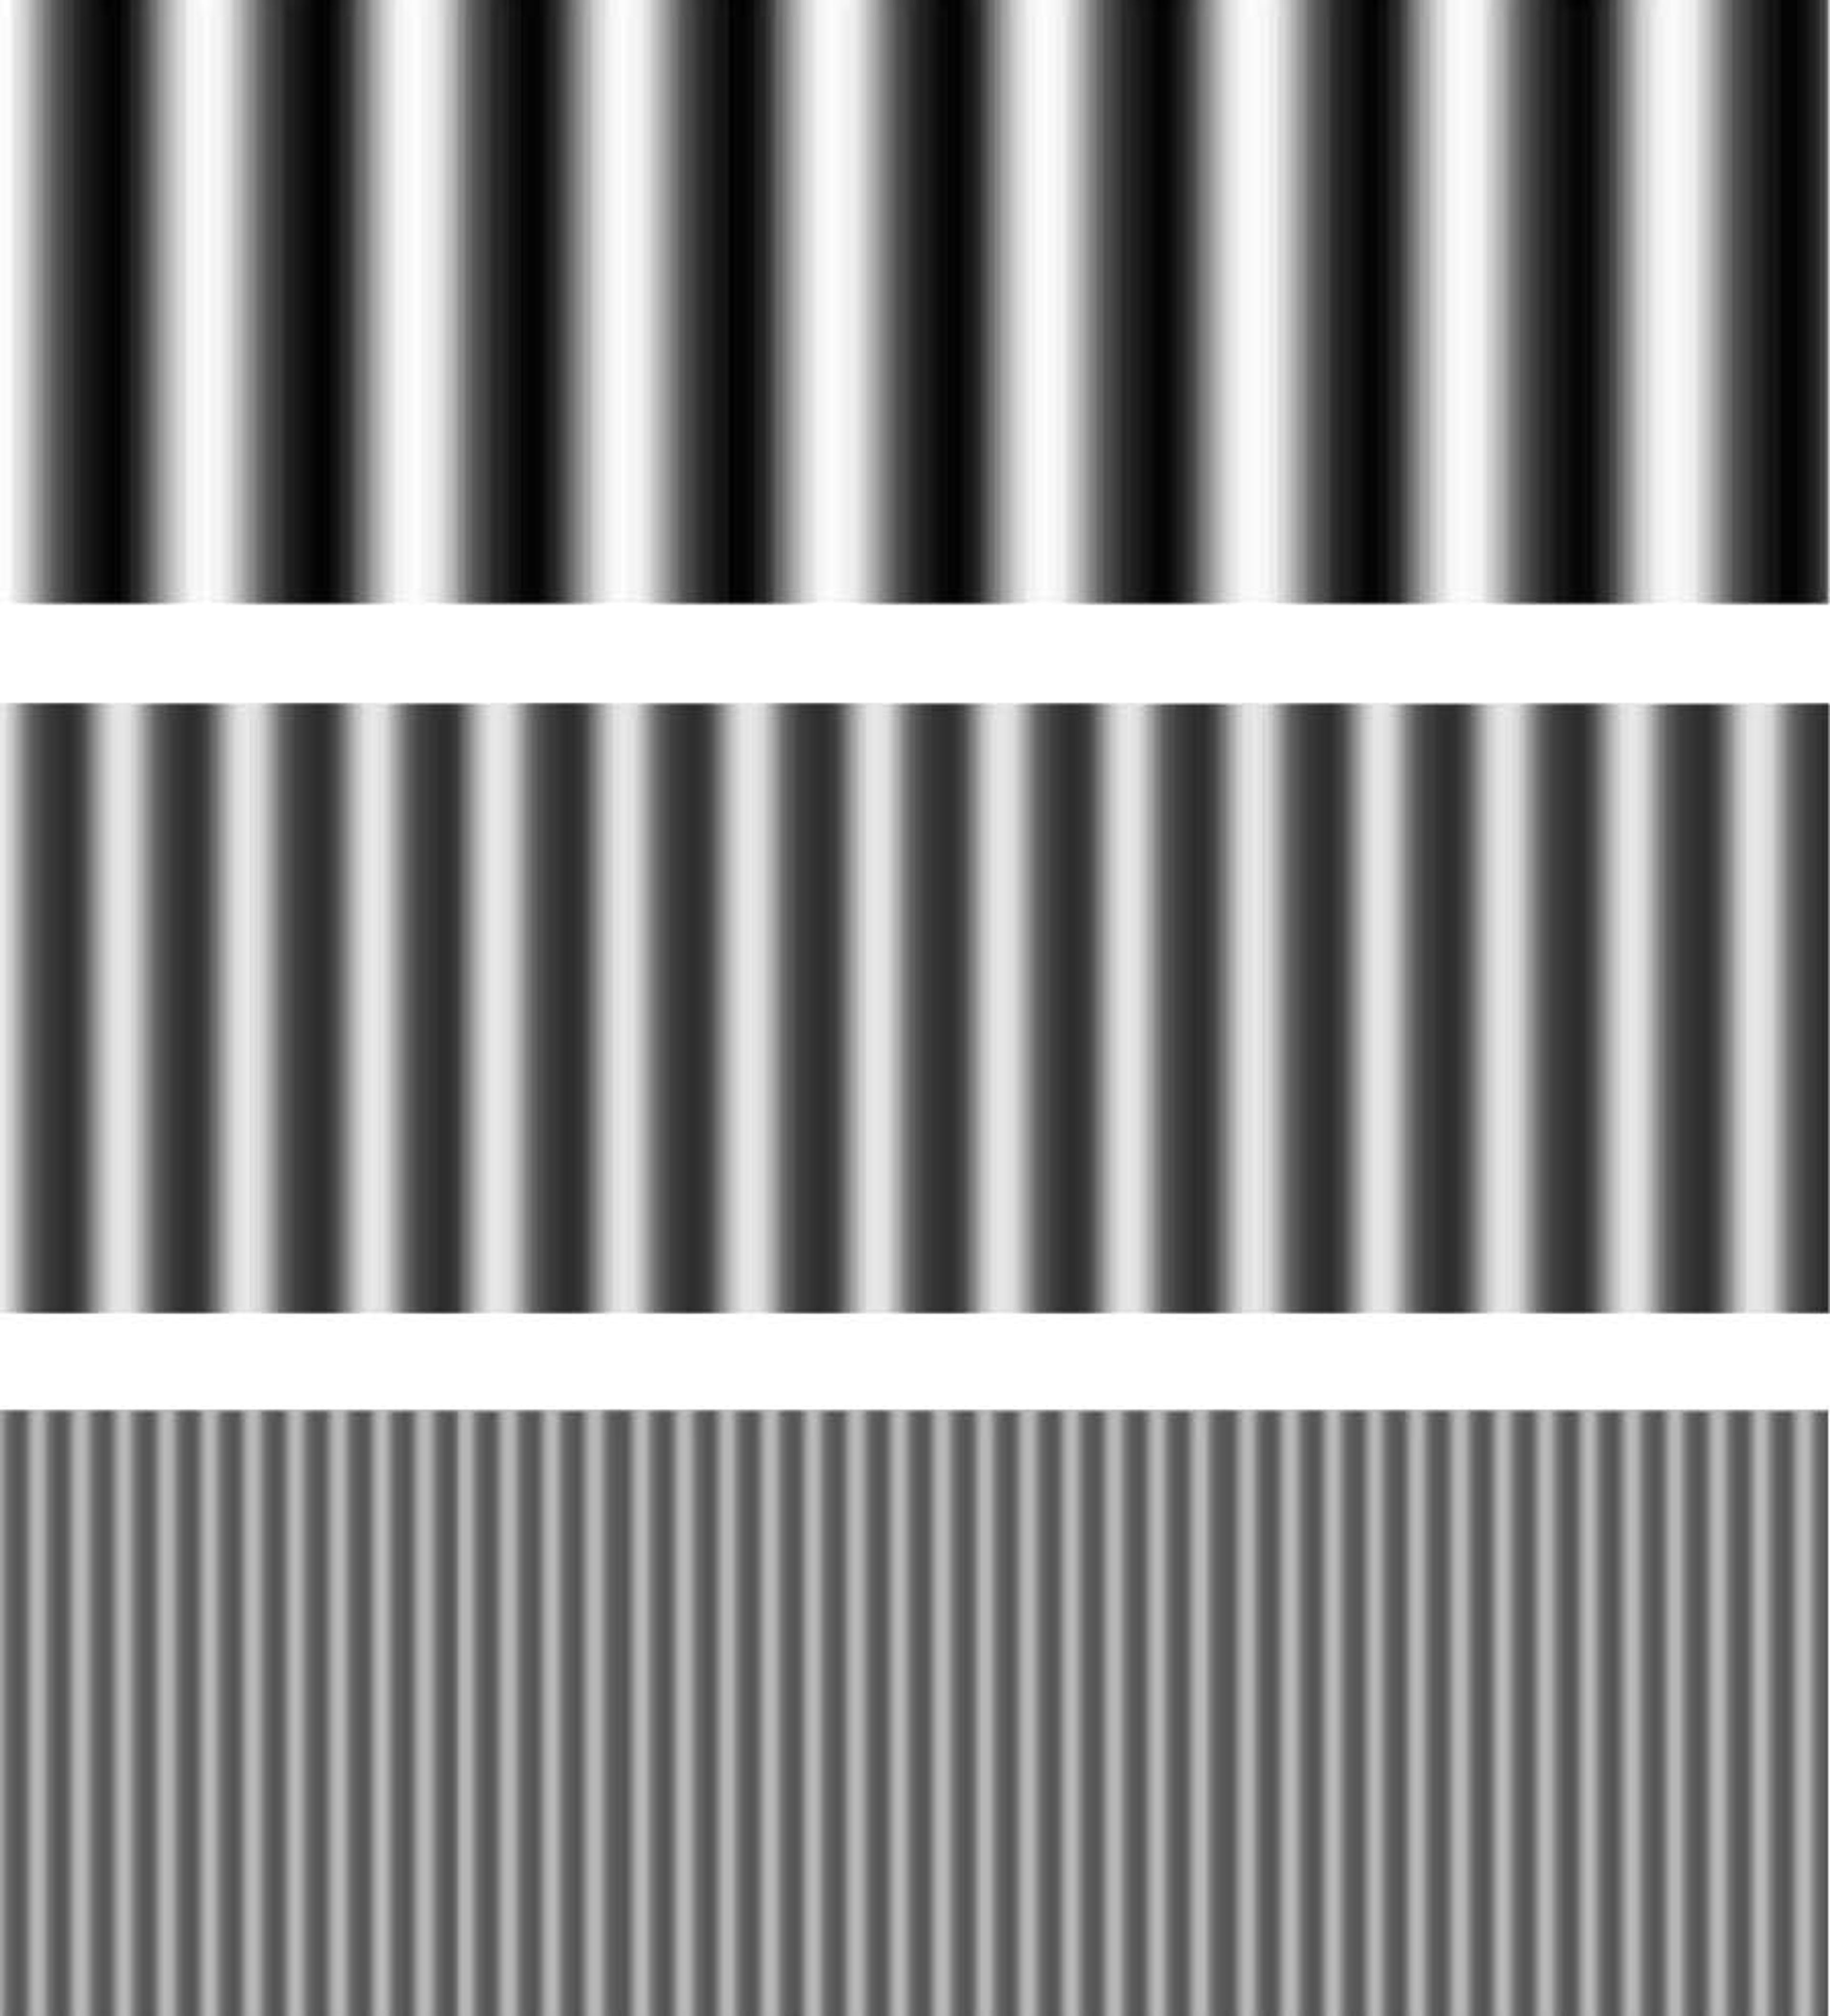
Figure 2
Perhaps the most unexpected person in this story – at least for readers in the United States – is Vladimir Kotelnikov, the man who turned Fourier’s idea into the pixel. Born in Kazan of a centuries-long line of mathematicians, Kotelnikov lived through the entire Soviet era – the First World War, the Russian Revolution, the Second World War and the Cold War. The NKVD, forerunner of the Soviet security agency the KGB, tried to imprison him twice during Stalin’s time, but a protector – Valeriya Golubtsova – saved him both times. She could because her mother was a personal friend of the Russian revolutionary Vladimir Lenin, and she herself was the wife of Georgi Malenkov, Stalin’s immediate successor as leader of the Soviet Union.
Early in his career, Kotelnikov showed how to represent a picture with what we now call pixels. His beautiful and astonishing sampling theorem, published in 1933 (Figure 3 below), is the foundation of the modern picture world. The wiggly shape in the Russian snippet figures in our story.

Figure 3, from Vladimir Kotelnikov’s 1933 article
Americans are usually taught that Claude Shannon first proved the sampling theorem, but he never even claimed it. It was ‘common knowledge’, he said. Several countries have claimants to the title, but Kotelnikov was the first to prove the entire theorem as it’s used today. Russians certainly believe so. In 2003 in the Kremlin, on the 70th anniversary of Kotelnikov’s proof, Russia’s president Vladimir Putin awarded him with the Order of Merit to the Fatherland.
Kotelnikov’s great sampling idea is built on the shoulders of Fourier’s great wave idea. Consider the 1D signal in Figure 4 below – an audio signal, say, or one line through a visual scene. The same idea works for both sound and pictures. The horizontal line represents 0 loudness (for sound) or 0 brightness (for pictures):

Figure 4
From Fourier, we know that any such smooth signal can be expressed as a sum of waves of different frequencies and amplitudes. Figure 5 below shows one such Fourier wave. It has the highest frequency because nothing in the given signal wiggles any faster. Kotelnikov has us find that highest Fourier frequency, then place evenly spaced dots along the signal at twice that rate.

Figure 5
Kotelnikov’s astonishing discovery was that we can throw away the signal between the dots but not lose anything. We can simply omit the infinity of points between each pair of dots. The regularly spaced samples – at the dots (Figure 6 below) – of the smooth original signal carry all the information in the original. I hope you’re amazed by that revolutionary statement. It enabled the modern media world. In the case of pictures, we call each such sample a pixel. A pixel exists only at a point. It’s zero-dimensional (0D), with no extent. You can’t see a pixel.

Figure 6
Kotelnikov also showed how to restore the original signal from the samples – how to make an invisible pixel visible. Figure 7 below repeats the wiggly shape from Kotelnikov’s 1933 paper. I call it a spreader. You’ll soon see why:

Figure 7
But this ideal spreader has a serious flaw: it wiggles off to infinity in both directions forever. That’s fine in mathematics, but in the real world we cannot use infinitely broad things. So we substitute a spreader of finite width, such as the popular and effective one shown in Figure 8 below:

Figure 8
The sampling theorem has us place a spreader at each sample (Figure 9 below). We adjust the height of each to that of the sample:

Figure 9
Then add up the results (Figure 10 below) to get the bold line at the top. It’s the original signal reconstructed from the samples. All we had to do was spread each sample with the spreader, and add up the results. That’s Kotelnikov’s amazing theorem.

Figure 10
But pictures are 2D. The spreader for pixels looks like a little hillock (Figure 11 below). The cross-section reveals an edge that is exactly the 1D spreader we’ve just used in our example:
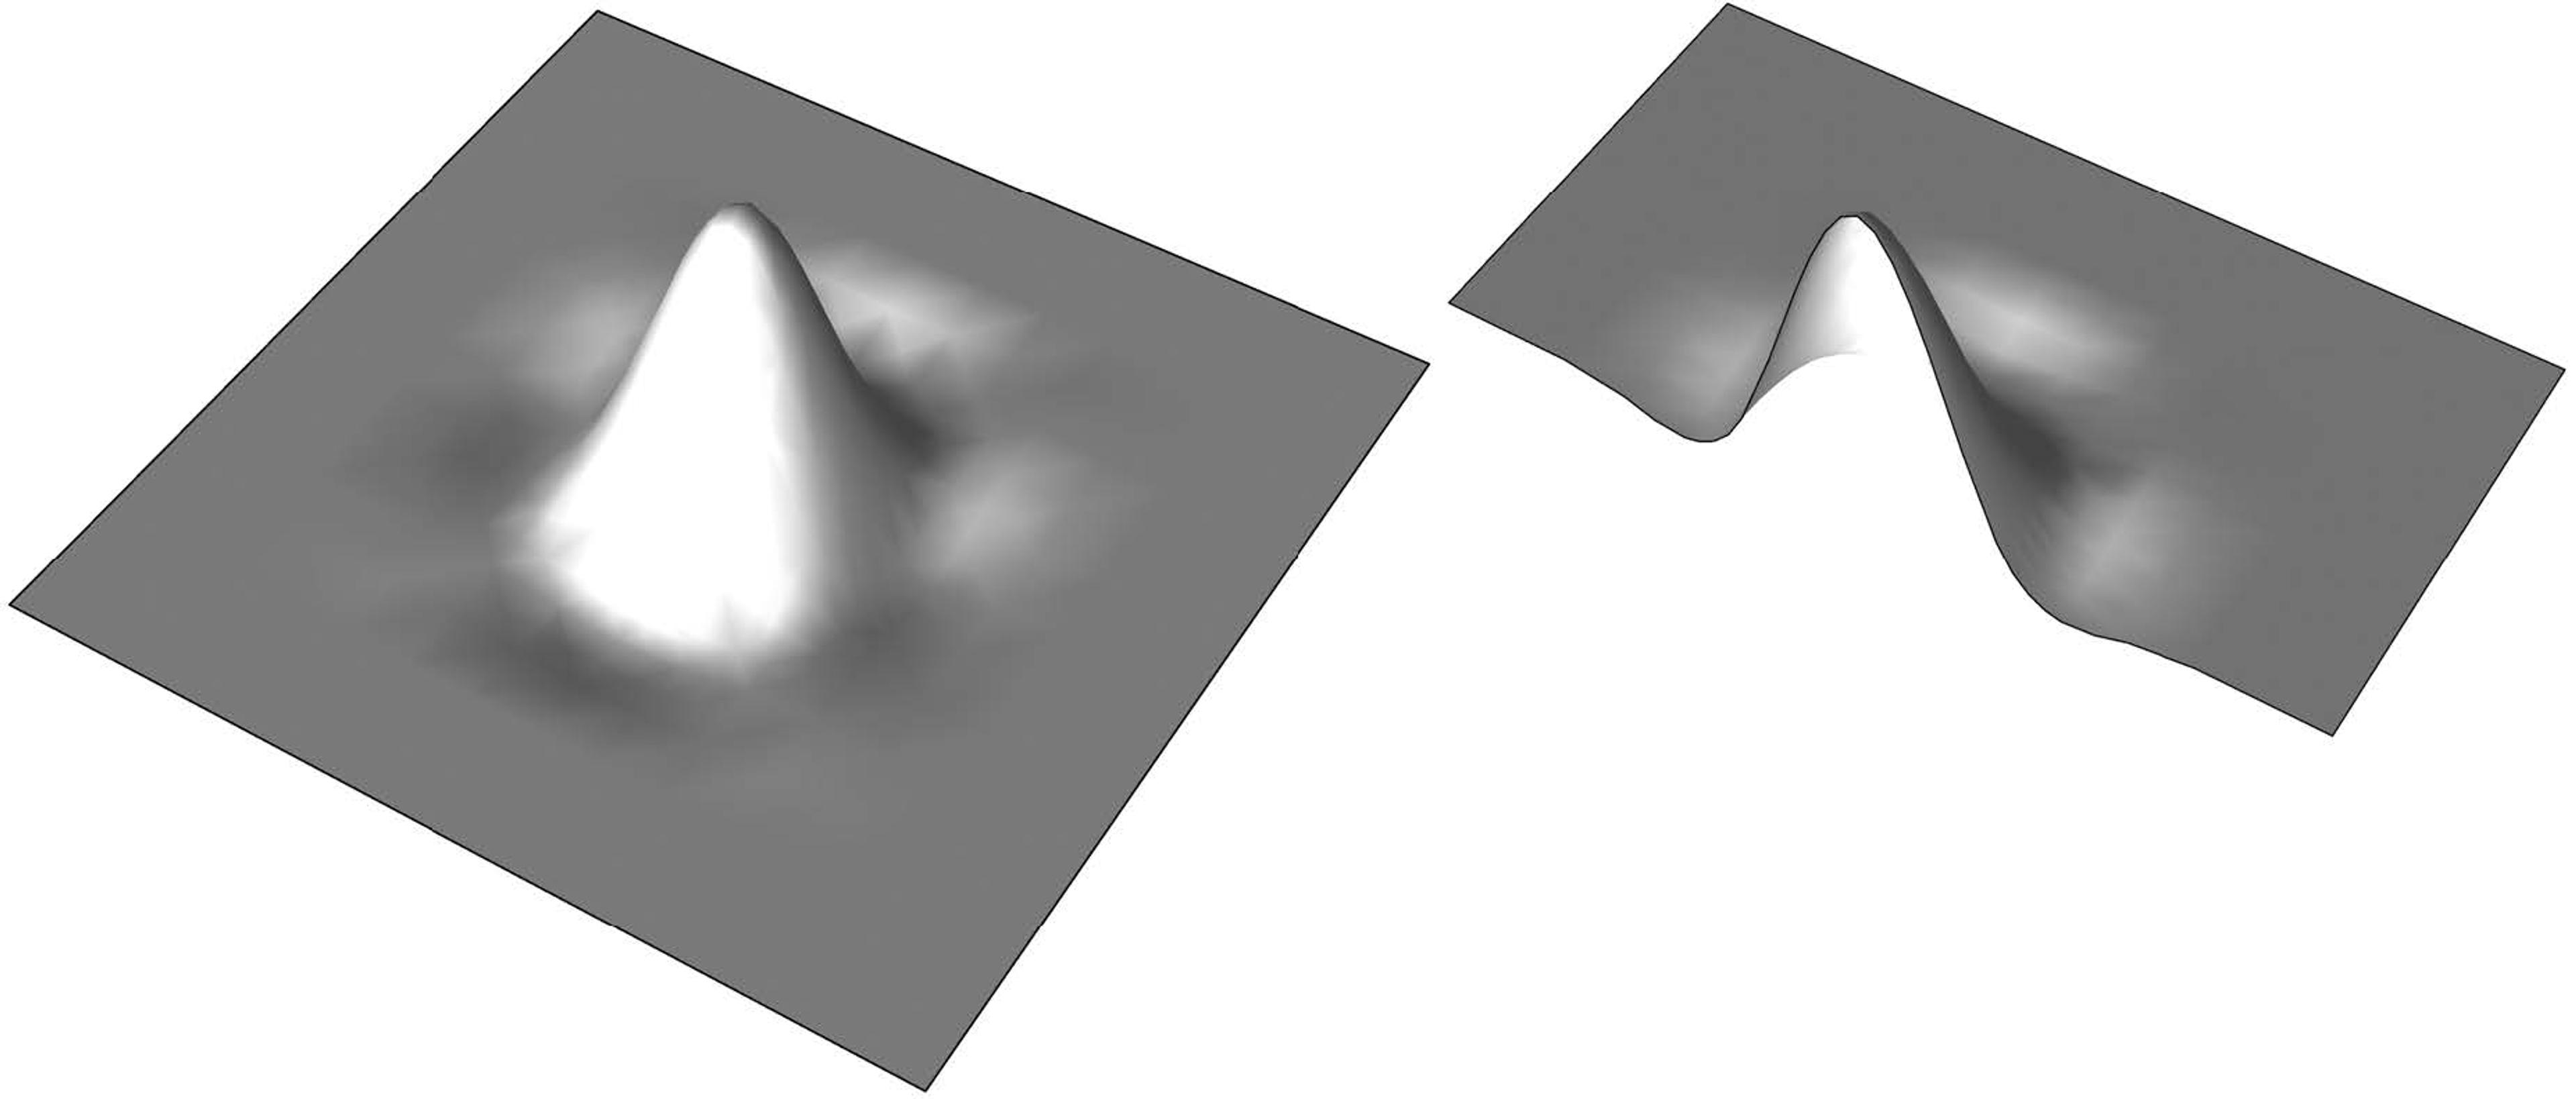
Figure 11
Thus, a digital picture is like a bed of nails, each nail a pixel. To restore the original picture to visibility, we spread each pixel with the little hillock spreader, and add up the results. That hillock – that little ‘blob of infinity’ – supplies the missing infinities between the pixels. That’s the repackaging of infinity. It’s a very neat trick. It’s not at all obvious that this scheme should work, but the mathematics of the sampling theorem proves it so. And it demonstrates once again the remarkable power of mathematics to take us to unintuitive and extremely useful places.
You carry pixels around in your cellphone, say, stored in picture files. You cannot see the pixels. To see them, you ask for a picture file to be displayed. Typically, you ‘click on it’. Because of the astounding speed of today’s computers, this seems to happen instantaneously. The digital pixels are sent to the display device, which spreads them with the little glowing spots on the display’s screen. The act of display is the process I just described and diagrammed. Those glowing spots are actual pixel-spreaders at work.
Many people call these spots pixels – a very common error. Pixels are digital, separated, spiky things, and are invisible. The little glowing spots are analogue, overlapped, smooth things, and are visible. I suggest we call each a ‘display element’ to distinguish it from a ‘picture element’ (which is what the word ‘pixel’ abbreviates). Display elements and pixels are fundamentally different kinds of things. Display elements vary from manufacturer to manufacturer, from display to display, and over time as display technologies evolve. But pixels are universal, the same everywhere – even on Mars – and across the decades.
Why do so many think that pixels are little squares? Apps have fooled us with a cheap and dirty trick
I have not invoked a little square even once in this discussion. A pixel – an invisible 0D point – cannot be a square, and the little glowing spot of light from a display device generally isn’t either. It can be, but only if the spreader is a hard-edged box – an unnatural shape, a mesa with a square footprint. A square mesa is a jarringly crude approximation to the gentle hillock spreader supported by the sampling theorem.
So why do so many people think that pixels are little squares? The answer is simple: apps and displays have fooled us for decades with a cheap and dirty trick. To ‘zoom in’ by a factor of 20, say, they replace each pixel with a 20-by-20 square array of copies of that pixel, and display the result. It’s a picture of 400 (spread) pixels of the same colour arranged in a square. It looks like a little square – what a surprise. It’s definitely not a picture of the original pixel made 20 times larger.
There’s another reason for the myth of the little square. Pixelation is a trivialising misrepresentation, but it’s consistent with a general tendency throughout the early history of digital light. The assumption was that computer-generated pictures must be rigid, linear, ‘mechanical’ and ungraceful because, well, computers are rigid, linear and so forth. We now know this is completely false. The computer is the most malleable tool ever built by humankind. It imposes no such constraints. Convincing avatars of human beings in emotional closeup are beginning to abound on computers. But it took decades to erase this faulty prejudice. Some remnants still survive – such as the notion of square pixels.
Taking pictures with a cellphone is perhaps the most pervasive digital light activity in the world today, contributing to the vast space of digital pictures. Picture-taking is a straightforward 2D sampling of the real world. The pixels are stored in picture files, and the pictures represented by them are displayed with various technologies on many different devices.
But displays don’t know where the pixels come from. The sampling theorem doesn’t care whether they actually sample the real world. So making pixels is the other primary source of pictures today, and we use computers for the job. We can make pixels that seem to sample unreal worlds, eg, the imaginary world of a Pixar movie, if they play by the same rules as pixels taken from the real world.
The taking vs making – or shooting vs computing – distinction separates digital light into two realms known generically as image processing and computer graphics. This is the classical distinction between analysis and synthesis. The pixel is key to both, and one theory suffices to unify the entire field.
Computation is another key to both realms. The number of pixels involved in any picture is immense – typically, it takes millions of pixels to make just one picture. An unaided human mind simply couldn’t keep track of even the simplest pixel computations, whether the picture was taken or made. Consider just the easiest part of the sampling theorem’s ‘spread and add’ operation – the addition. Can you add a million numbers? How about ‘instantaneously’? We have to use computers.
Not only did the first computer have pixels, but it could animate
Computation and the stored-program computer concept were invented by Alan Turing in 1936. Then the race was on to build a machine to make his ideas, fast. Turing himself tried but failed to build the first ‘computer’ – which is short for ‘electronic, stored-program computer’, exactly what we mean by the word today. The British engineers Tom Kilburn, Geoff Tootill and (Sir) Freddie Williams won that race by creating the first computer, nicknamed (believe it or not) the Manchester Baby in 1948.
Baby had pixels! That bears repeating: the first computer had the first pixels! It displayed the first spread pixels. A further surprise awaited me when I visited Baby (a replica actually) in Manchester in 2013 for my research. Baby displayed the word ‘PIXAR’ scrolling to the right. Not only did the first computer have pixels, but it could animate.
There are actually photographs of the first and second digital picture on Baby’s display (just the pretty unexciting letters CRT STORE for the first picture). But nobody appears to have ever made pictures on it again. It seemed too frivolous to use a unique expensive machine for pictures instead of, say, atom bomb calculations. In 1998, when the Baby replica was built to celebrate its 50th anniversary, no such disdain for pictures remained. Today, it’s unnatural to think of computers without pictures. In fact, we have a special name for them – servers.
Once computers appeared, digital pictures, games and animations soon followed – on some of the earliest of the new beasts. The first interactive electronic game appeared in 1951, also in Manchester. And the second and third interactive games arrived in 1952 and 1953, in Cambridge, UK. The first digital animation was recorded in 1951, in Cambridge, US, and shown on Edward R Murrow’s television show See It Now.
But this was the era of dinosaur computers, large, slow and dim-witted. To advance from that primitive state to the era of digital light required an energy source of awesome power.
In 1965, the Moore’s law revolution began – a marvel not yet fully grasped. I cannot overemphasise its importance. It’s the supernova dynamo that has powered the modern world and particularly digital light. My version of the law is this: everything good about computers gets better by an order of magnitude every five years (Figure 12 below). That’s an intuitive expression of the law usually stated in this unintuitive way: the density of components on an integrated circuit-chip doubles every 18 months. But they are equivalent.

Figure 12
I use ‘order of magnitude’ rather than the merely arithmetical ‘factor of 10’ because it suggests a mental limit. An order-of-magnitude change is about as large as a human can handle. Larger implies a conceptual leap. Moore’s law has required one every five years. Today, the Moore’s law factor exceeds 100 billion: computers are 100 billion times better now than in 1965. In just a few years, the factor will hit 1 trillion. That’s 12 orders of magnitude – far beyond any human’s ability to predict. We must ride the storm surge to see where it takes us.
A first fruit of Moore’s law was colour pixels. I found the first ones on the Apollo Moon Project simulator (Figure 13 below) built early in 1967 by the engineers Rodney Rougelot and Robert Schumacker for NASA. This was also the first example of 3D shaded colour graphics. They used the new devices, integrated circuit chips, described by Moore’s law.
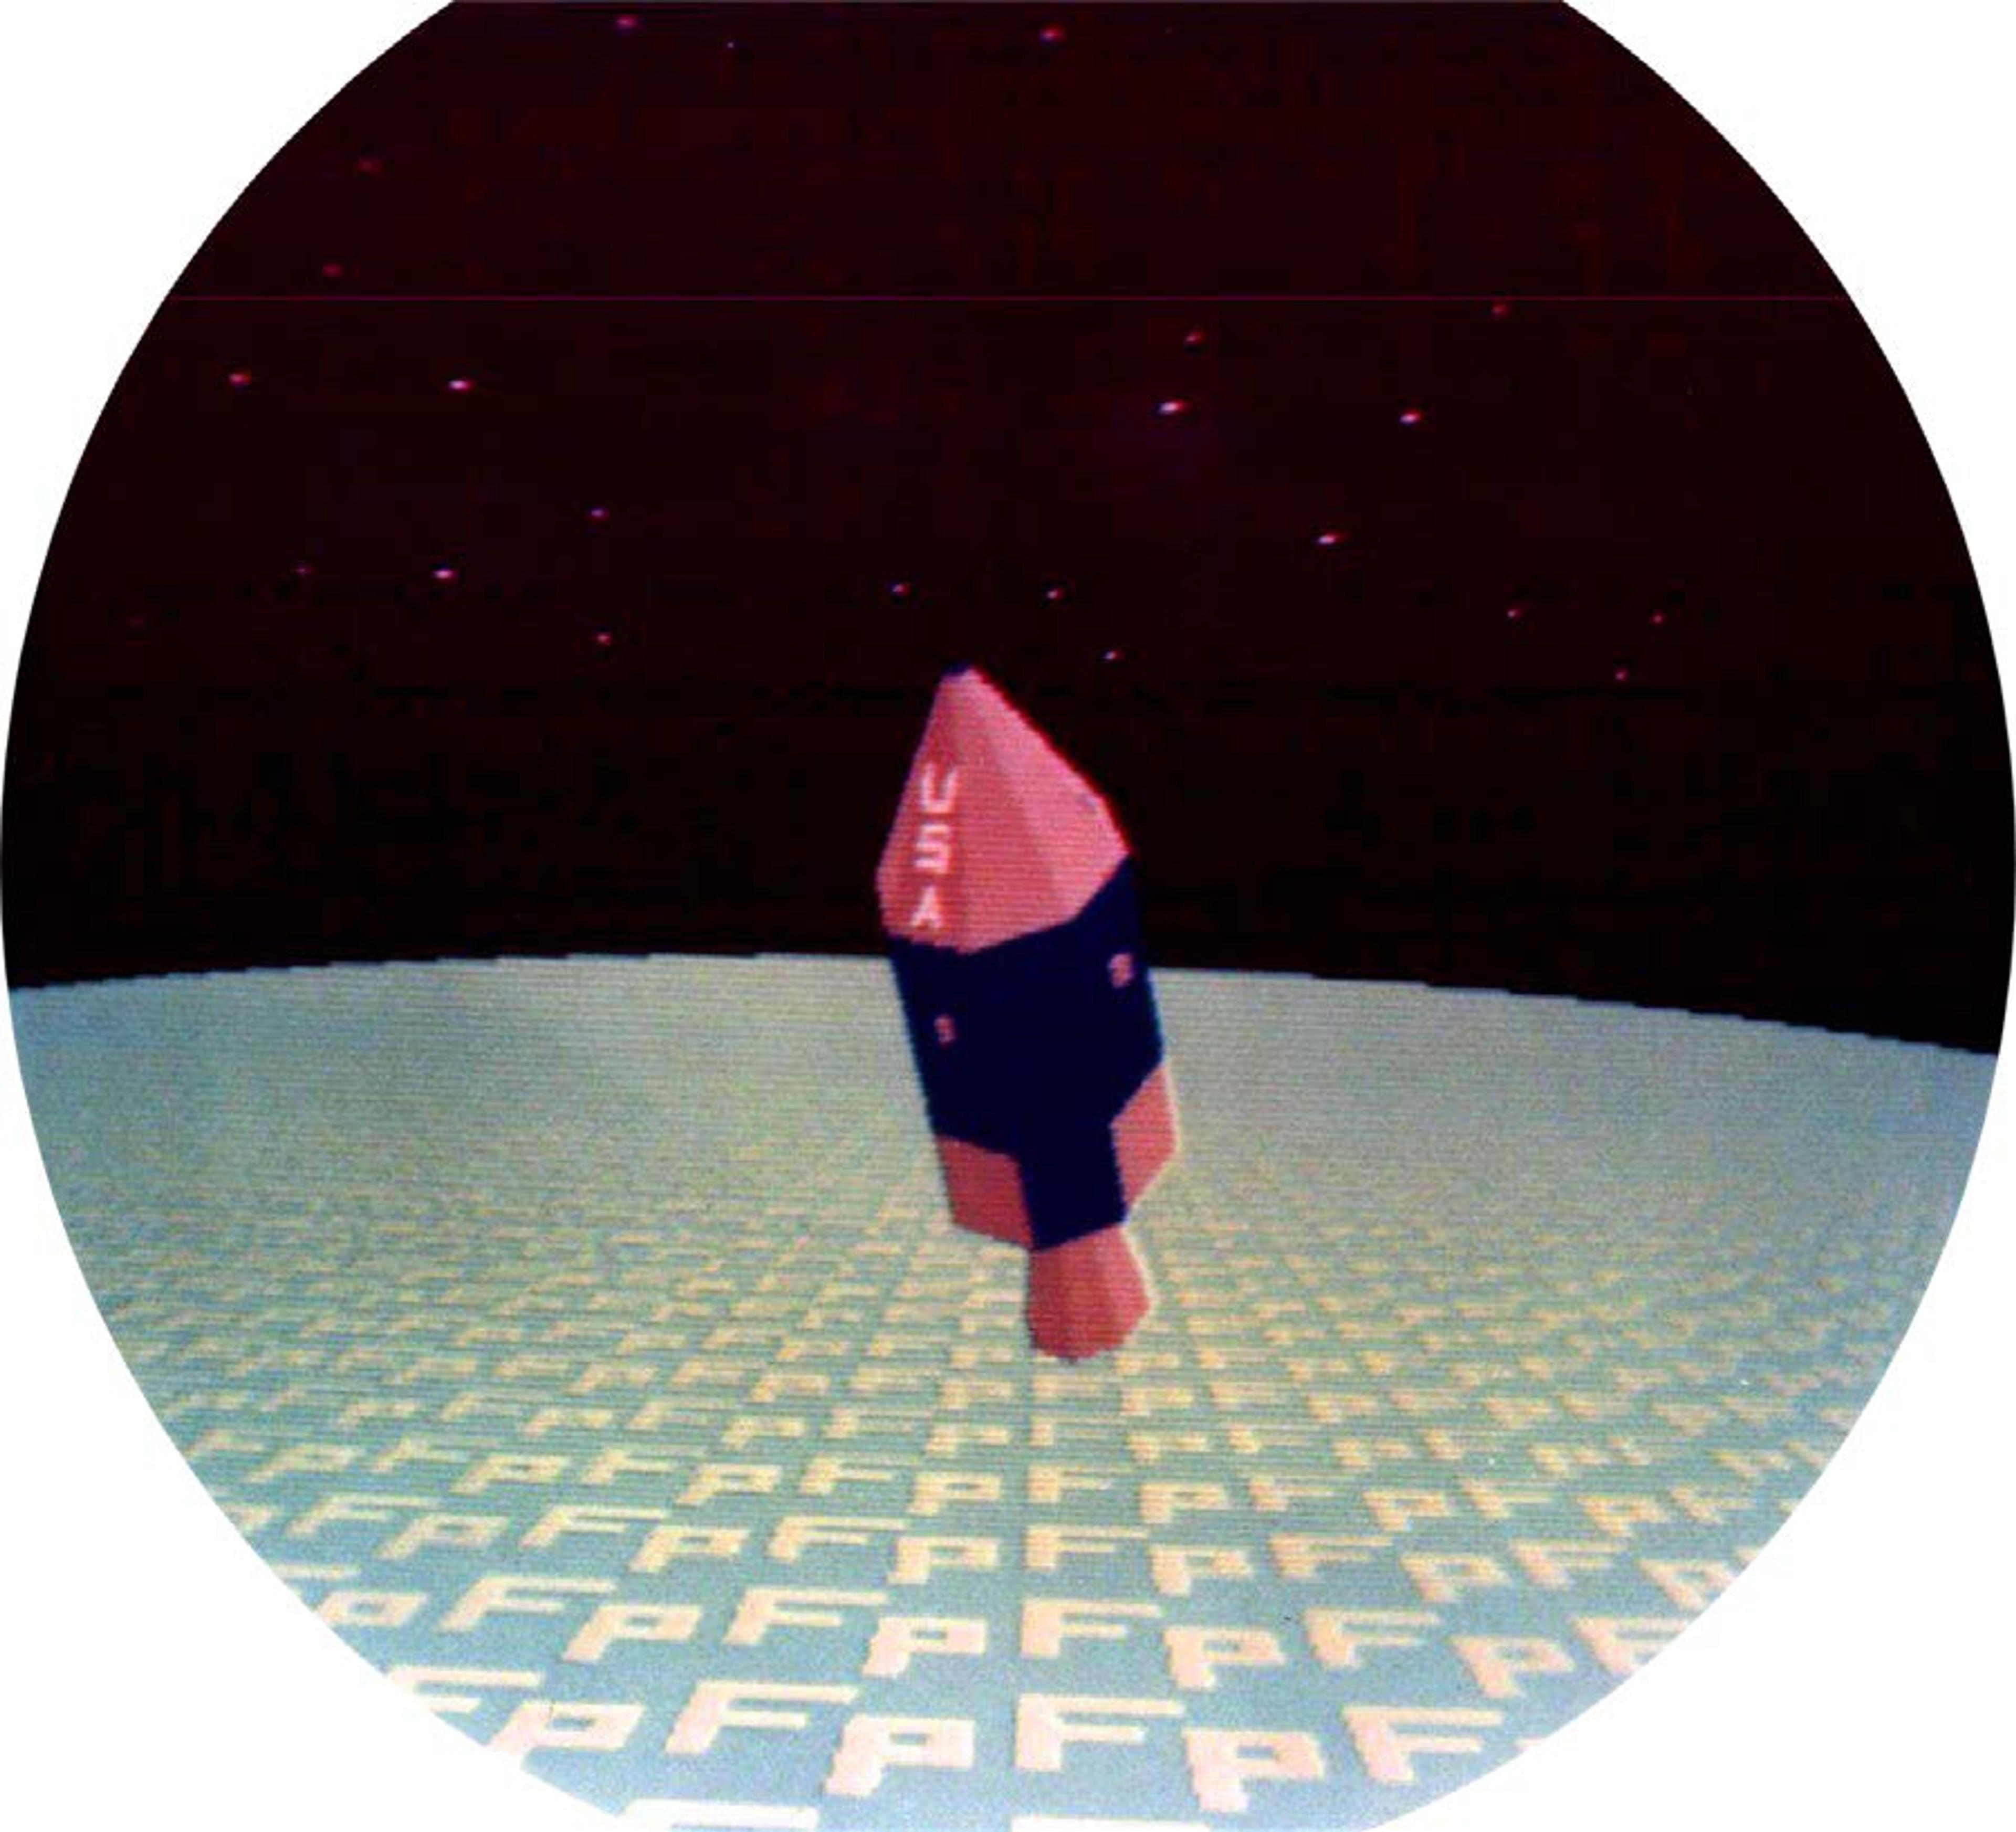
Figure 13. Courtesy of NASA
The basic idea was to model an unreal world, store that model in computer memory, and then render it into pixels to be spread on the display. That, in fact, can be taken to be the definition of computer graphics. Rougelot and Schumacker created a model of the Apollo Lunar Module, which didn’t yet exist, described it using 3D Euclidean geometry and Newtonian physics, and then flattened it into a 2D picture with Renaissance perspective. Their computer sampled this visual scene into pixels and displayed them as shown above.
What had been ink and paper, photographs, movies and TV, became – in a blink of the eye – just pixels
To repeat: computers are the most malleable tool ever invented. There’s nothing about them that restricts digital pictures to the Euclidean-Newtonian-Renaissance straightjacket used in that first colour model. But remarkably, most 3D computer graphics pictures in the world today still work this way. Most flamboyantly, we use essentially this technique to create the imaginary worlds of digital movies. I call it the central dogma of computer graphics, a self-imposed ‘symphonic form’.
Our everyday experience of the world is a picture that changes in time. It’s 3D – two dimensions of space and one of time – but Fourier and Kotelnikov theories still apply. A digital movie uses sampling to recreate that experience. We call the time sample a frame, and each frame is made of pixels.
I concentrate on the movies, but electronic games, virtual reality, flight simulators and other forms of digital light are not essentially different. What distinguishes them from the movies is that their computations proceed in ‘real time’ – that is, so fast that a human believes the simulated world is changing in synchrony with the clocks of the actual world. A movie computer might take an hour to compute a single frame (it took more than a year to compute the original Toy Story) while a game has to do it in, say, a 30th of a second. But the techniques are essentially the same, and Moore’s law has steadily eaten away at the speed disparity.
Moore’s law finally made digital movies possible. Back in 1986, the computer scientist Ed Catmull and I created Pixar hoping to make the first completely digital movie, while knowing that we were five years shy of the necessary horsepower. As if on cue from the Moore’s law, Disney stepped forward with the funding in 1991, and Pixar used it to make Toy Story (1995). That plus the digital movies Antz (1998) by DreamWorks and Ice Age (2002) by Blue Sky Studios were bright flags waving proudly at the millennium. Digital movies announced with dazzling glory that the great digital convergence had occurred and the era of digital light had begun.
Other developments converged. The digital video disc debuted in 1996. The first broadcast of the new high-definition television signal occurred in 1998. A digital camera of professional quality threatened film cameras in 1999. What had been ink and paper, photographs, movies and television, became – in a blink of the historical eye – just pixels. The change was so fast that young people today might have never experienced non-digital media except, of course, in those museums and kindergartens.
We are only two decades into the new era – but that’s already four orders of magnitude distant from the millennium. The media revolution based on the profound, but simple, pixel proceeds unabated. We’re still riding the surge.
This essay is based on A Biography of the Pixel by Alvy Ray Smith, published on 3 August 2021 by MIT Press (Leonardo Series).


