Danielle Walquist Lynch/Flickr
Americans are getting slower. It sounds outlandish because life, in general, is becoming faster. Compared with a generation ago, things move more quickly: cars go faster, communication is instantaneous, deliveries arrive the next day. According to a 2007 study, we are even walking faster than ever. In such a fast-paced, innovative world, you might think that people would be running faster than ever, too. But you’d be wrong.
At RunRepeat.com, we analysed more than 34 million marathon results over a period of 20 years and found that runners in the United States are gradually becoming slower. There is a considerable rise in the average finishing time for all major races including the 5k, 10k, half-marathon, and marathon.
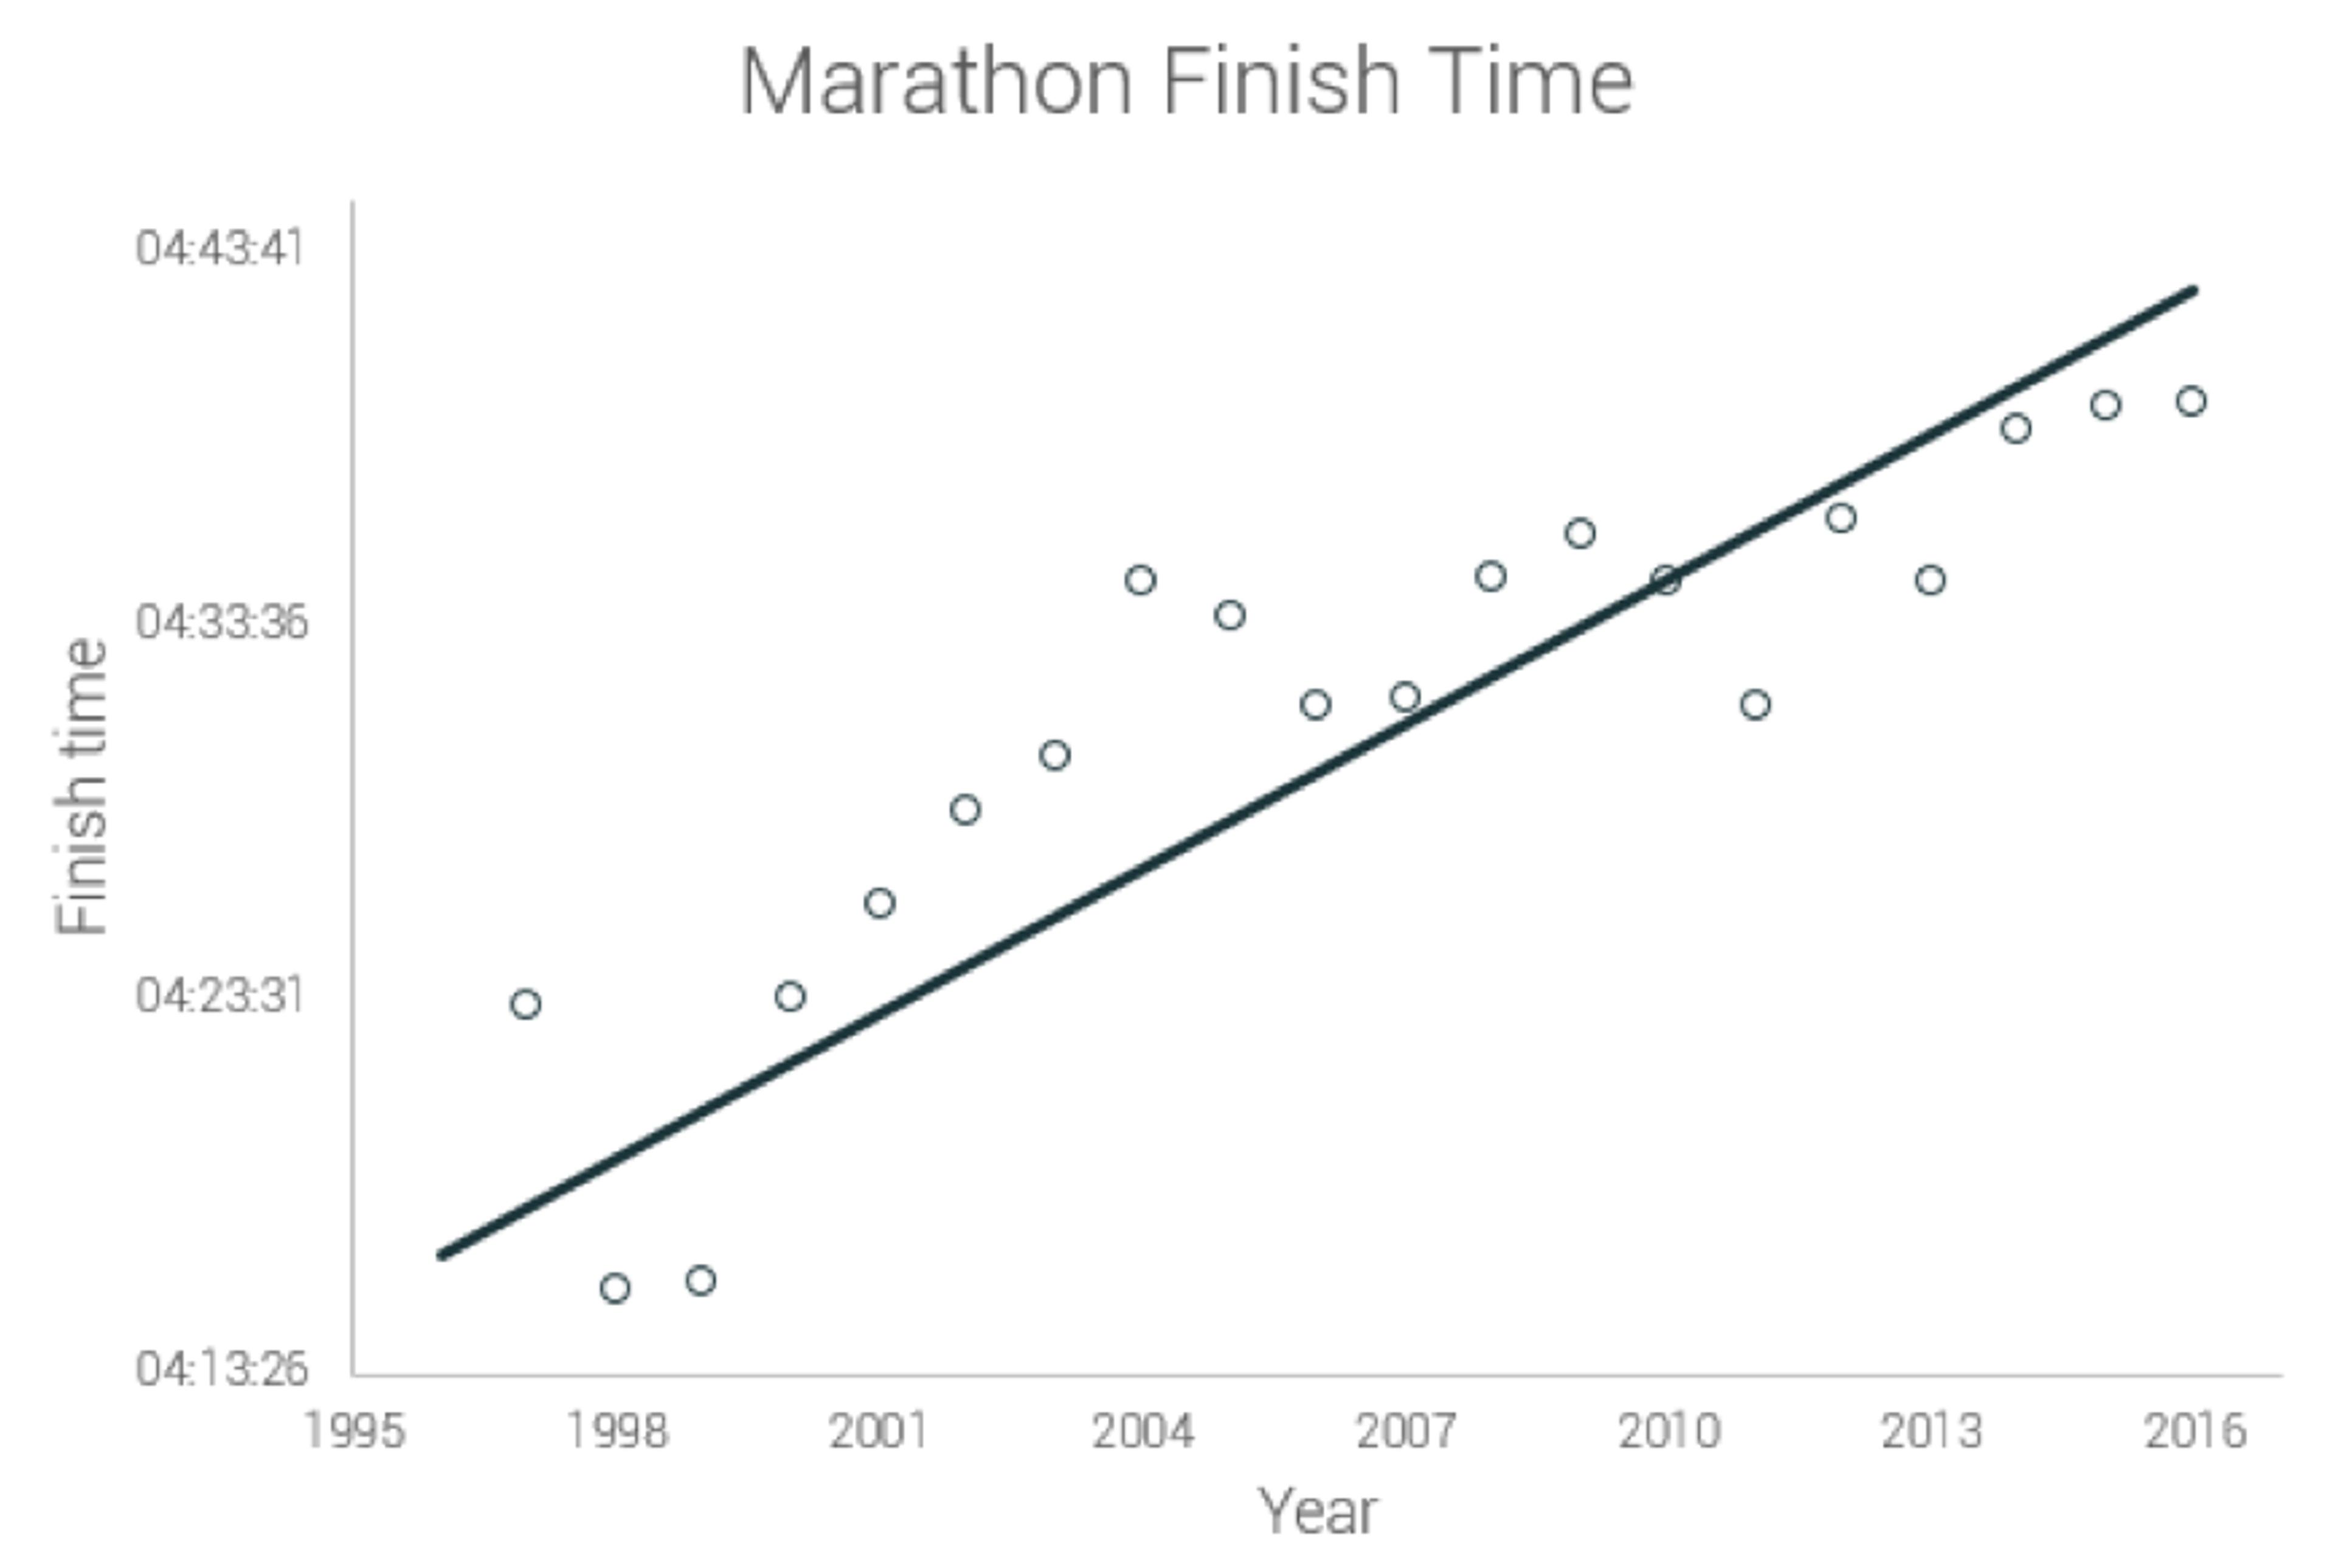
Fig 1: The upward trend in the average finish time; 2016 is the slowest with the average finish time at 4:40, up from 4:20 back in 1996
Why is this happening? Lots of theories have been proposed, both before and after we published our findings. Some think it’s because of the increasing number of recreational runners in the races, or perhaps thanks to the rise in the number of female runners. Others suggest it is because slow runners are getting slower. Then there’s the possibility of a decline in overall health and fitness levels. But which of these suggestions are supported by the evidence?
It’s true that a lot more people participate in marathons compared with some years ago. The number of finishers in all US marathons has grown from fewer than 300,000 in 1995 to more than 500,000 in 2016. This year, the entry quota for the largest half-marathon in the US was filled in a record 26 minutes. A majority of these newcomers are happy to make it to the finishing line without bothering much about their time. Competitiveness has taken the backseat, and these races are more like social events than serious competitions. For old-schoolers, it’s easy to blame the newcomers for rising finishing times. The numbers, however, suggest otherwise.
Those who place the blame on recreational runners argue that they mostly walk the race, skewing the average finishing time higher. But the data show that the number of people who just walk is pretty much consistent throughout these races. If more people are walking the distance, the number should be on the rise, but that’s not the case. Also, the slowing-down trend is evident in the averages for 100th, 1,000th, 2,000th, or 5,000th finishes.
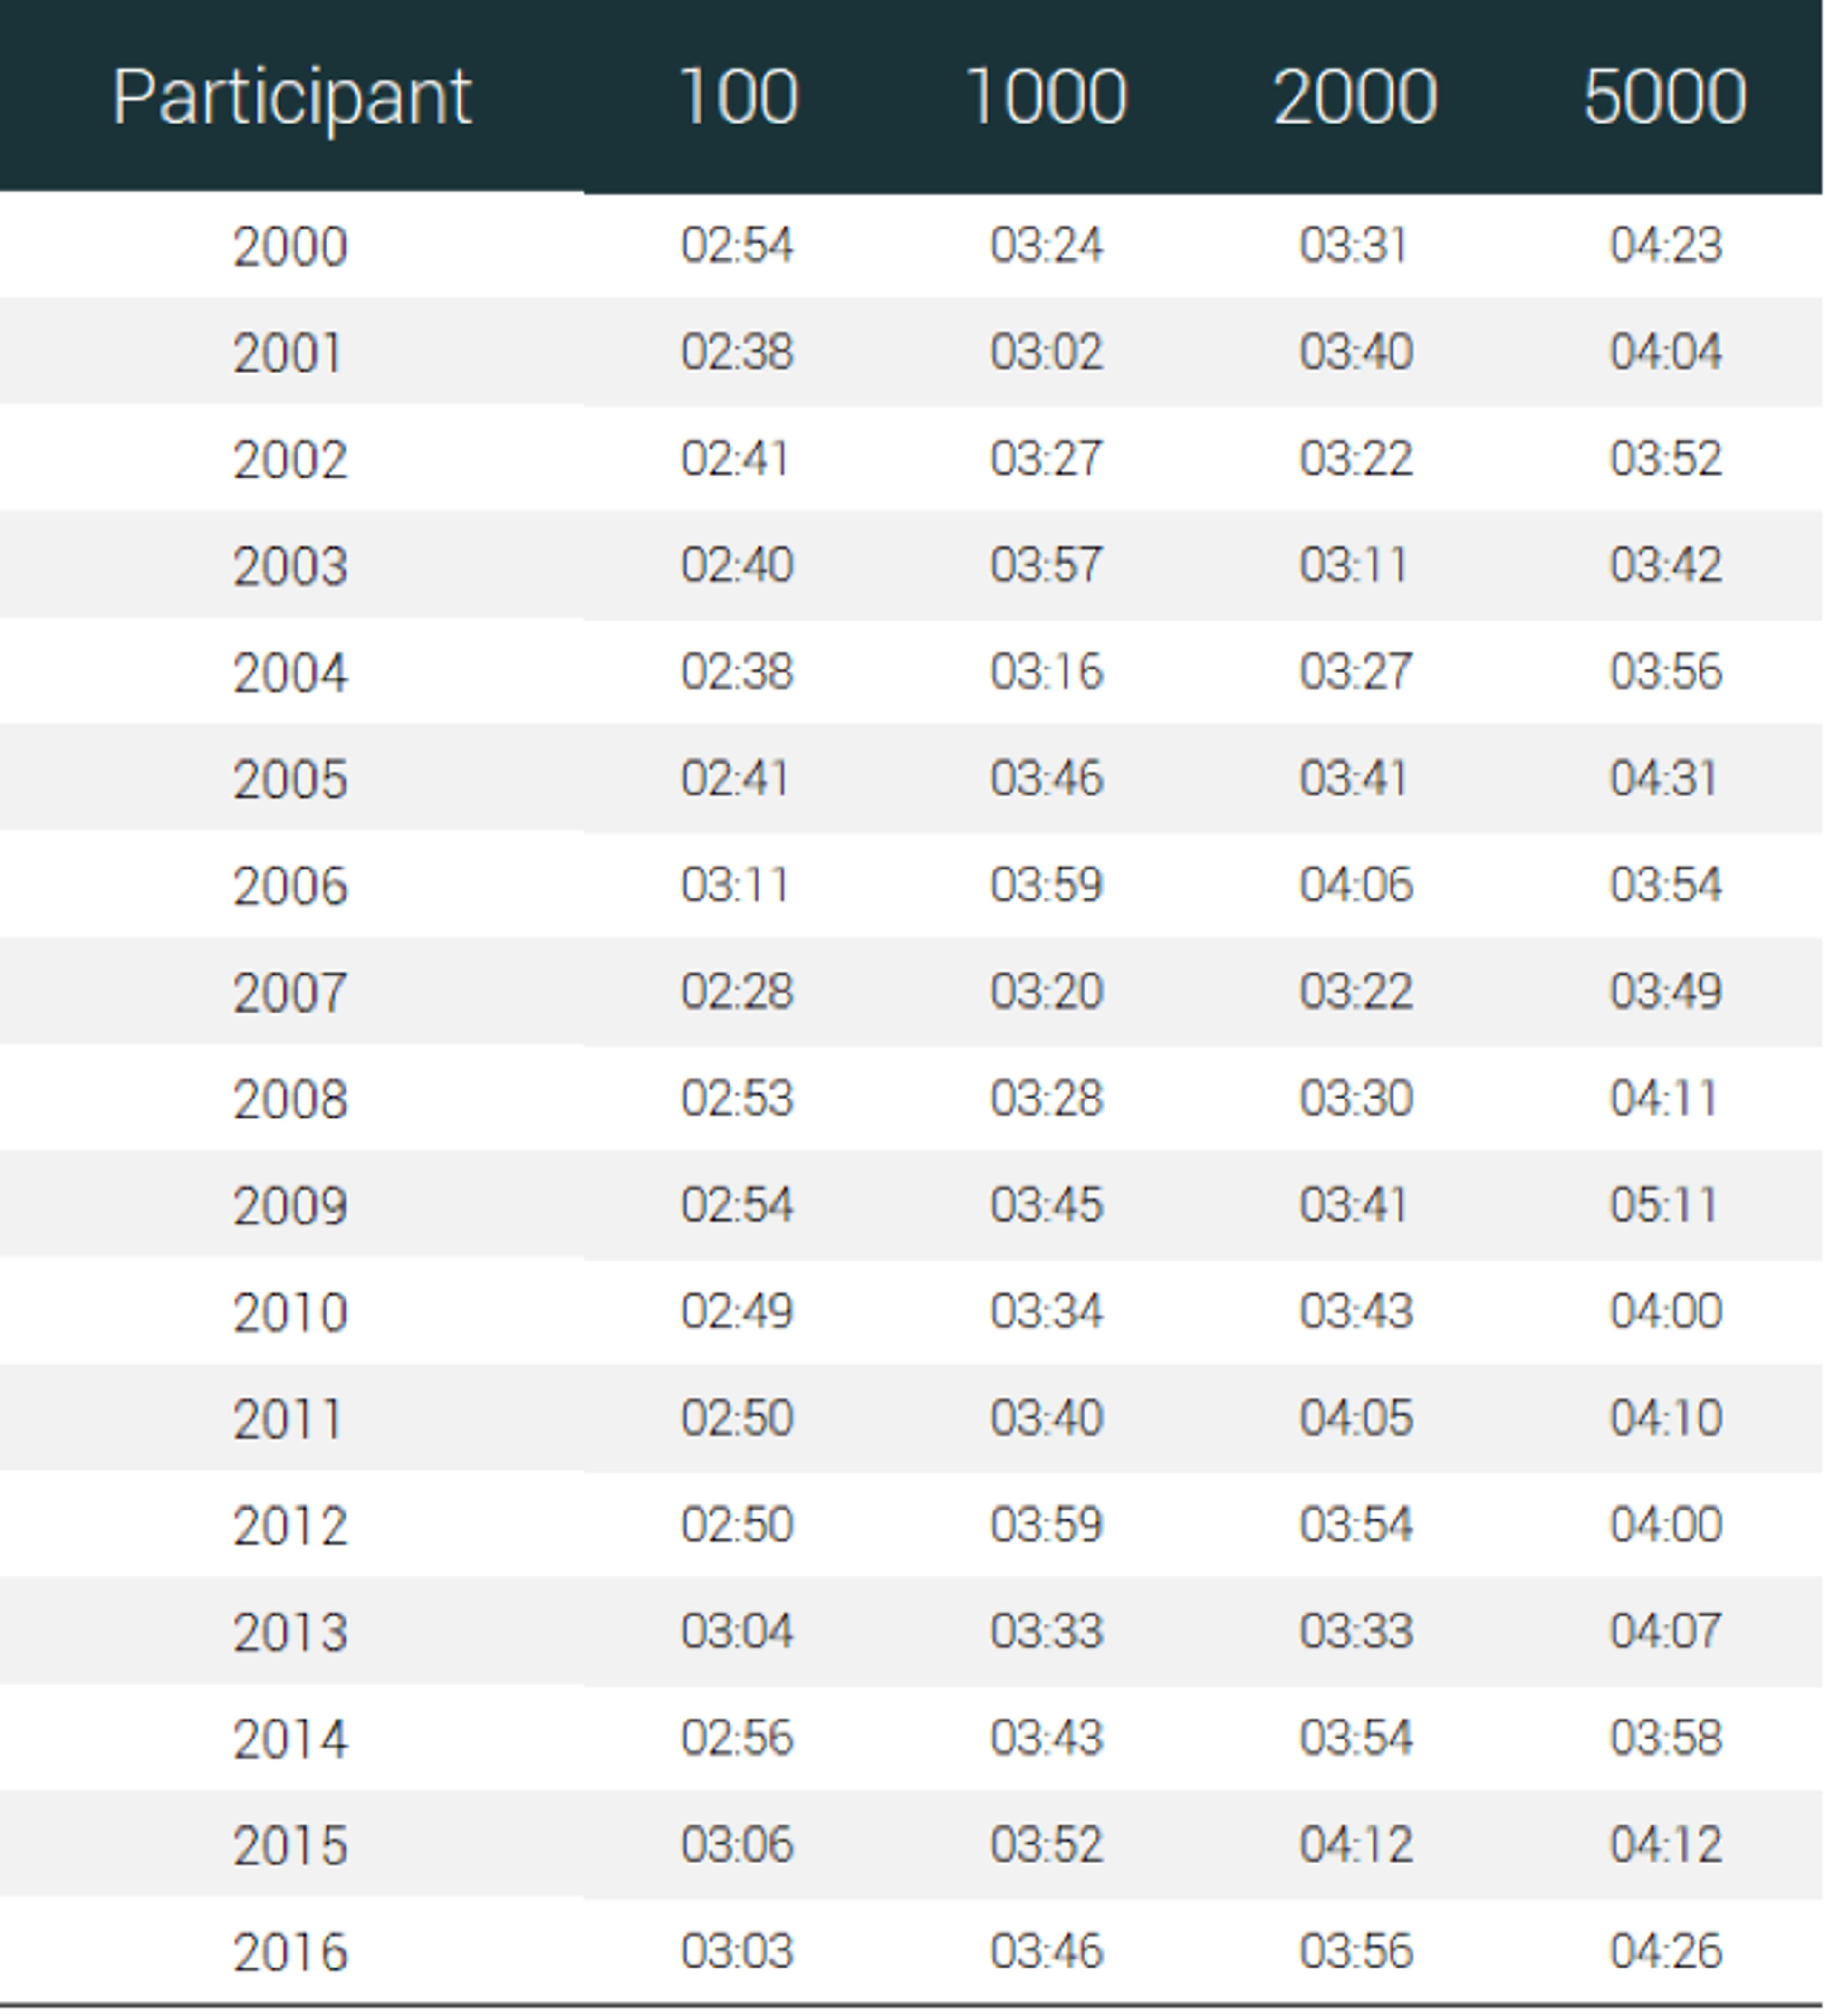
Fig 2: It’s not just the slower ones who are getting slower; the finishing times are rising on every level
This theory is also quashed by the fact that a similar drop in speeds is seen in marathons that are considered tough (the Catalina Eco in California, Whiskey Row in Arizona, or the Boston marathon, for instance). These races do not attract many recreational runners because of tough qualifying standards that keep first-timers and walkers to a minimum. However, the average finishing time in these races is on the decline as well.
What of the theory that blames the US slowdown on female runners? Women are naturally slower than men due to physical and hormonal differences. There has been a significant increase in the number of female participants in recent years. Maybe their rising numbers are driving down the average speed? But this is not the case: we found that the rise in the number of female runners has a lesser effect (46 per cent) compared with the decline in men’s speed (54 per cent). (It is also worth noting that men are more likely than women to slow down in marathons.)
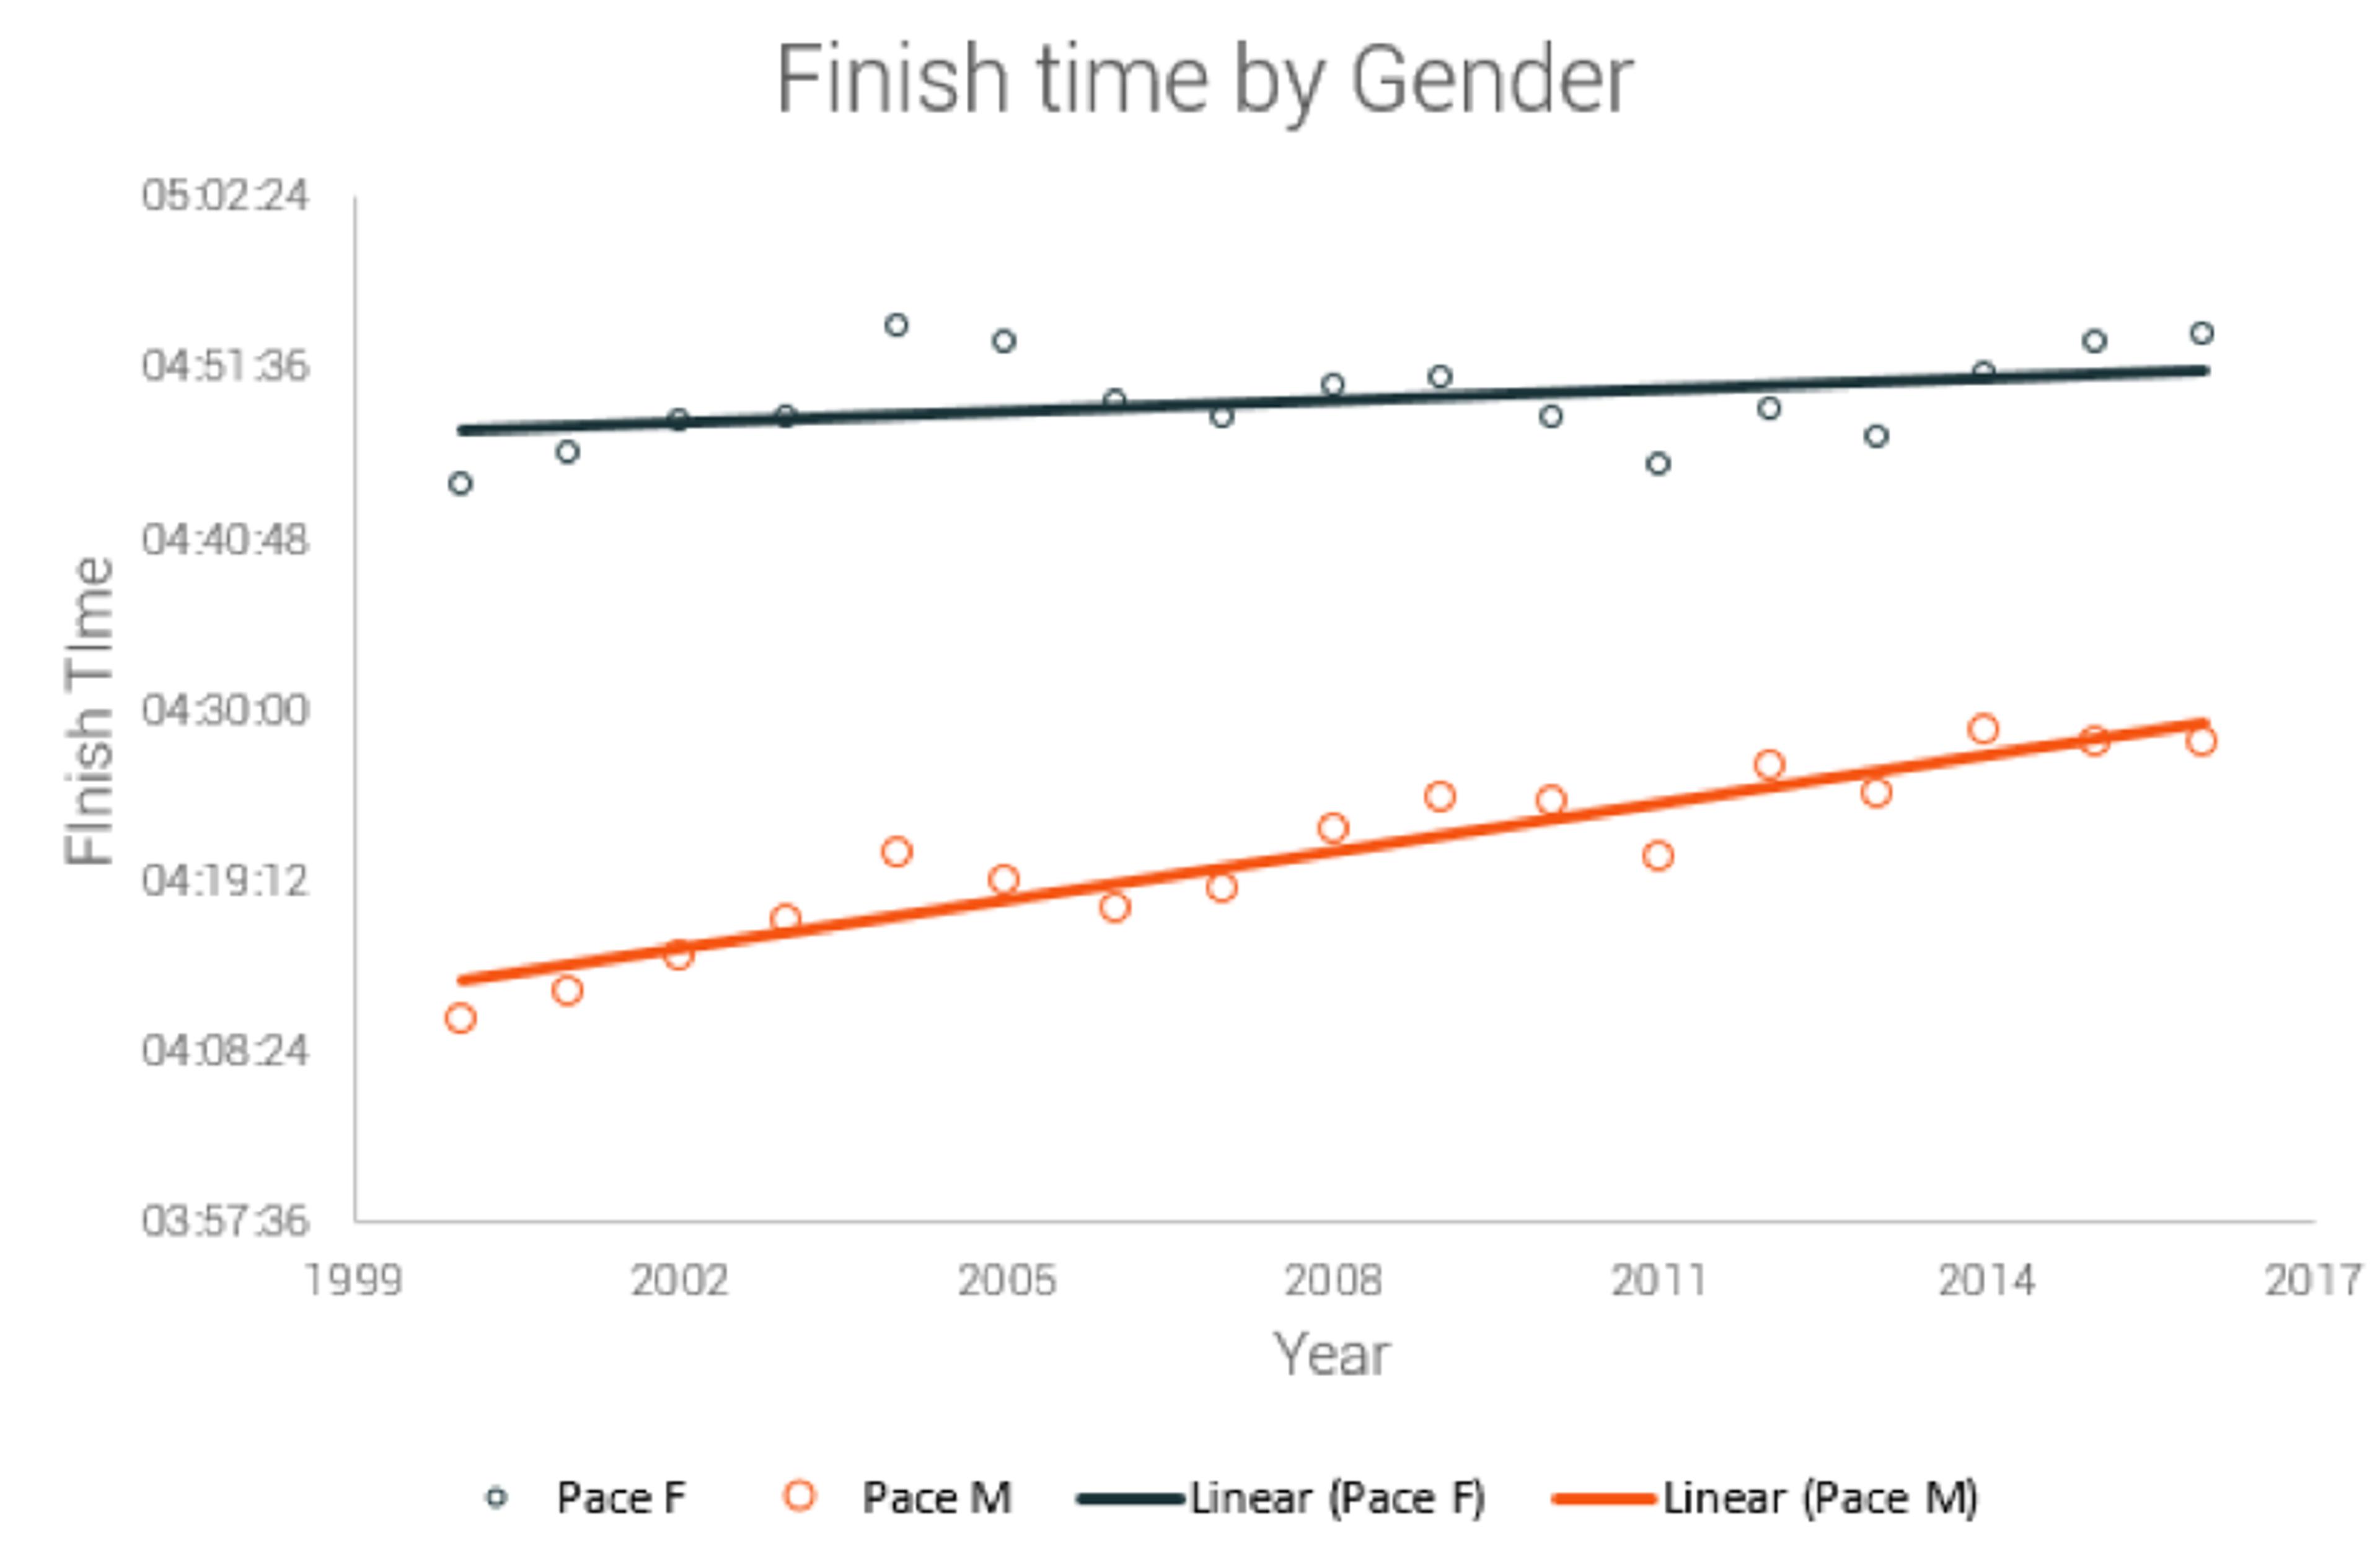
Fig 3: The slowing-down trend is common in both genders but men seem to be slowing down at a much higher rate
Another theory focuses on the rising age of marathon runners. Participants are supposed to get slower as they age, and we found that the average age of runners has climbed from 37 to 41. Indeed, this increase could solve the puzzle if the speeds are dropping in a specific age group, but they aren’t. In reality, runners from all age groups have slowed down by an average of 15 per cent.
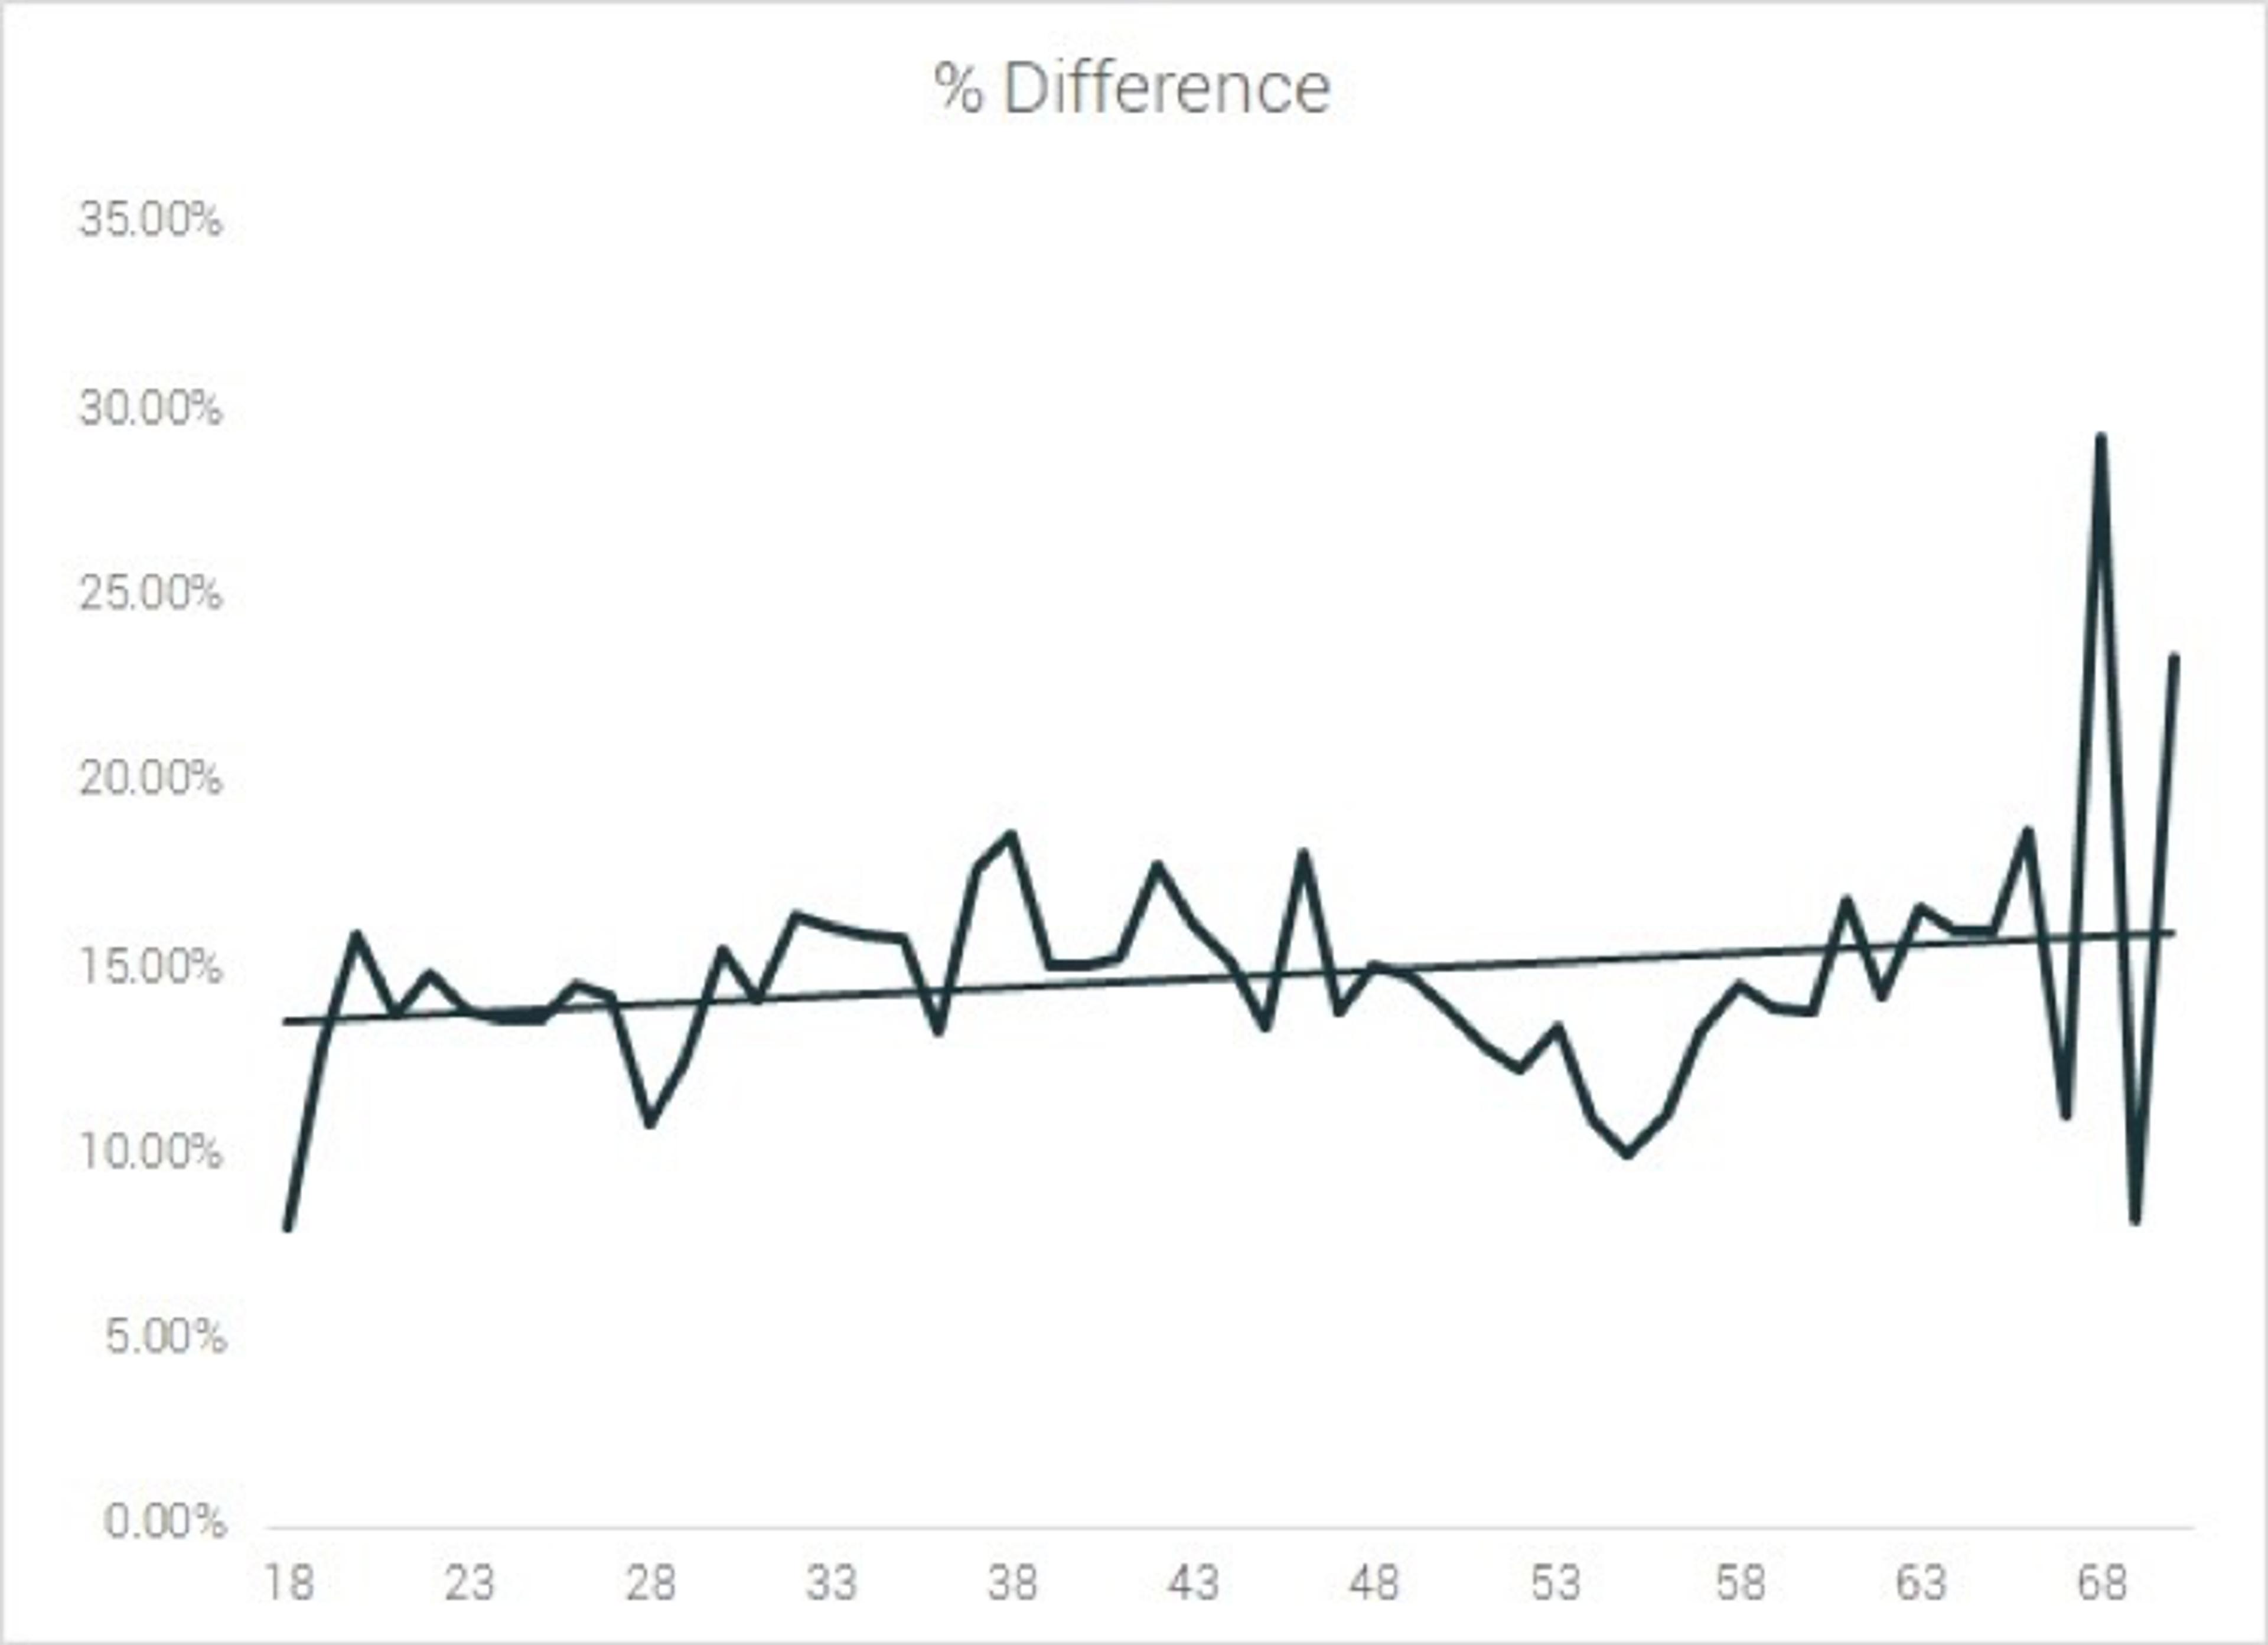
Fig 4: The slowness is evident in all age groups
The most important theory points to the declining level of health and fitness. The latest data from the US Department of Health and Human Services don’t paint a rosy picture: more than 80 per cent of adults don’t follow its guidelines for physical activities, and less than 5 per cent of adults spend 30 minutes a day exercising. So perhaps this theory stacks up.
We compared the national average rates of obesity, diabetes and annual medical expenditure with the average finish times. This time, the results showed a clear correlation that is 99 per cent significant and replicable in various circumstances. Keep in mind that we don’t have the data for the participants so we can’t be absolutely sure that the dropping averages are due to obese or unhealthy people taking part in the races; instead, we used the health parameters of the general population. Nevertheless, it seems that the average finish times are declining in tandem with the deteriorating state of fitness in the US.
These results prompted us to look into the finishing times of UK runners (these findings are to be published soon). Interestingly, there is no similar drop in the average finish time – even though the number of participants has also increased. There is, however, a similar correlation with the health parameters that we used in our study of US runners; this backs up the theory that the blame lies in declining national levels of health.
There is one other possibility. Ultramarathons and triathlons are growing in popularity. It could be that fitter and faster runners are focusing on more competitive races such as these, at the expense of marathons. Here, elite runners are improving speeds. In 1996, the record finishing time was a little over 2 hours and 10 minutes – now it is down to 2 hours and 5 minutes. When some of these runners upgrade to tougher races, we are left with the beginners or middle-tier runners mostly to fill their spots. This view is encouraged by the fact that the slowing-down is happening at a much higher rate than the improvements in the top runners’ speeds.
Yet all things considered, the theory that stands up best to scrutiny is the declining health of Americans. We can’t say with certainty that it is the only explanation but there’s certainly a strong connection. So, while most won’t notice if the average marathon time goes up or down, the underlying reasons should be cause for some alarm. The bright spot, though, is that interest and participation in marathons have been on the rise. This means that more people are turning towards healthy activities. Maybe, the problem in question is a part of long-term solution. Only time will tell.
